Contamination-Aware Differential Gene Expression Analysis#
Background#
Imaging-based spatial transcriptomics methods like Xenium In Situ enable single-molecule RNA measurement but face a critical challenge: transcript spill-over due to imperfect cell segmentation. Transcripts from neighboring cells can be incorrectly assigned to target cells, particularly in densely packed tissues.
Problem: When performing differential gene expression (DGE) analysis, we cannot distinguish whether detected genes are:
Genuinely upregulated in target cells, or
Artifacts from misassigned transcripts from neighbors
Solution: Compare cells not only against each other but also against their spatial neighborhoods to identify contamination artifacts.
%load_ext autoreload
%autoreload 2
from pathlib import Path
from insitupy import InSituData, CACHE
from insitupy.tools import dge
import pandas as pd
Load Data#
insitupy_project = Path(CACHE / "out/demo_insitupy_project")
xd = InSituData.read(insitupy_project)

xd.load_images()
xd.load_cells()
xd.load_annotations()
Contamination-Aware DGE Workflow#
The dge() function performs contamination-aware differential gene expression analysis in a single step. It:
Compares target vs reference cell types (standard DGE)
Assesses neighborhood contamination for both groups
Integrates results to identify potential artifacts
Parameters:
consider_neighbors=True: Enables contamination analysisexclude_ambiguous_assignments=True: Filters genes with conflicting signals
# Run contamination-aware DGE analysis
dge_results = dge(
    target=xd,
    target_cell_type_tuple=("cell_type_dc_sub_final", "Breast cancer subtype 4"),
    ref_cell_type_tuple=("cell_type_dc_sub_final", "Breast cancer subtype 1"),
    ref=None,
    method="wilcoxon",
    consider_neighbors=True,
    exclude_ambiguous_assignments=True
)
Calculate differentially expressed genes with Scanpy's `rank_genes_groups` using 'wilcoxon'.
Building spatial graph (radius=20, weighted=False)...
Selected 6445 'Breast cancer subtype 4' cells as targets
Excluding same-celltype neighbors from adjacency matrix...
Computing mean neighbor expression...
Computing gex_diff = gex_target - gex_neighbor ...
Running paired tests (wilcoxon) per gene and computing effect sizes...
Applying multiple-testing correction...

============================================================
ANALYSIS SUMMARY
============================================================
Target cell type: 'Breast cancer subtype 4'
Target cells: 6445/156447 (4.1%)
Strategy: mean
Genes tested: 297
Target cells without neighbors: 1340 (20.8%)
Median neighbors per target cell: 3.0
============================================================

Building spatial graph (radius=20, weighted=False)...
Selected 31016 'Breast cancer subtype 1' cells as targets
Excluding same-celltype neighbors from adjacency matrix...
Computing mean neighbor expression...
Computing gex_diff = gex_target - gex_neighbor ...
Running paired tests (wilcoxon) per gene and computing effect sizes...
Applying multiple-testing correction...

============================================================
ANALYSIS SUMMARY
============================================================
Target cell type: 'Breast cancer subtype 1'
Target cells: 31016/156447 (19.8%)
Strategy: mean
Genes tested: 297
Target cells without neighbors: 13137 (42.4%)
Median neighbors per target cell: 2.0
============================================================
# Display results
print("\n=== DGE Results Summary ===")
print(f"Total genes: {len(dge_results.main)}")
print(f"Significant upregulated:")
print(f"\t- Target vs. reference: {((dge_results.main['padj'] < 0.05) & (dge_results.main['log2foldchange'] > 0)).sum()}")
print(f"\t- Target vs. neighborhood: {((dge_results.target_neighborhood['padj'] < 0.05) & (dge_results.target_neighborhood['log2foldchange'] > 0)).sum()}")
print(f"\t- Reference vs. neighborhood: {((dge_results.ref_neighborhood['padj'] < 0.05) & (dge_results.ref_neighborhood['log2foldchange'] > 0)).sum()}")
=== DGE Results Summary ===
Total genes: 297
Significant upregulated:
	- Target vs. reference: 57
	- Target vs. neighborhood: 79
	- Reference vs. neighborhood: 85
Understanding the Results#
The dge() function returns a DiffExprResults object containing:
Main attributes:
main: Standard DGE results (target vs reference)target_neighborhood: Target cells vs their spatial neighborhoodref_neighborhood: Reference cells vs their spatial neighborhoodconfig: Analysis configuration and metadata
Key columns in results DataFrames:
Column |
Description |
|---|---|
|
Log2 fold change between conditions |
|
FDR-adjusted p-value |
Accessing results:
# Main DGE results
main_results = dge_results.main

# Neighborhood comparisons (if consider_neighbors=True)
if dge_results.has_neighbors():
    target_nb = dge_results.target_neighborhood  # Target vs neighbors
    ref_nb = dge_results.ref_neighborhood        # Reference vs neighbors

# Get all results as dictionary
all_results = dge_results.get_all_results()
print(all_results)
{'main':           log2foldchange           padj      scores  neg_log10_pvals
gene
SERPINA3        5.463246  1.000000e-300  101.212189            300.0
CEACAM6         3.637490  1.000000e-300   94.099846            300.0
AGR3            4.773612  1.000000e-300   84.277008            300.0
TACSTD2         1.096257  1.000000e-300   64.926903            300.0
ESR1            2.567329  1.000000e-300   50.270954            300.0
...                  ...            ...         ...              ...
TCIM           -1.277700  1.000000e-300  -49.620869            300.0
MDM2           -0.940504  1.000000e-300  -50.664825            300.0
FASN           -0.892925  1.000000e-300  -60.591518            300.0
KRT7           -0.575407  1.000000e-300  -61.039478            300.0
ABCC11         -1.645688  1.000000e-300  -62.645016            300.0

[297 rows x 4 columns], 'target_neighborhood':         n_target_cells  n_cells_used  n_cells_expressed  mean_target  \
gene
ABCC11            6445          5105               2477     0.565558
ACTA2             6445          5105               2680     0.600571
ACTG2             6445          5105               3729     0.922865
ADAM9             6445          5105               3792     0.962086
ADGRE5            6445          5105                129     0.018626
...                ...           ...                ...          ...
VWF               6445          5105                245     0.037620
WARS              6445          5105               2004     0.358330
ZEB1              6445          5105                176     0.027682
ZEB2              6445          5105                344     0.051499
ZNF562            6445          5105               2836     0.558369

        mean_neighbor  log2foldchange  log2foldchange_unpaired         pvalue  \
gene
ABCC11       0.463177        0.147704                 0.368266   4.354693e-21
ACTA2        0.895618       -0.425663                -0.815663  4.306899e-123
ACTG2        0.968523       -0.065870                -0.107717   1.485075e-04
ADAM9        0.741608        0.318083                 0.556858   2.947663e-81
ADGRE5       0.071199       -0.075846                -1.972721   2.542418e-72
...               ...             ...                      ...            ...
VWF          0.091385       -0.077567                -1.319651   2.434527e-44
WARS         0.371862       -0.019522                -0.063830   1.270472e-01
ZEB1         0.159486       -0.190153                -2.622956  5.557927e-163
ZEB2         0.248829       -0.284686                -2.418438  1.280223e-203
ZNF562       0.472224        0.124282                 0.309204   1.206054e-18

                 padj  contamination_score
gene
ABCC11   8.290665e-21            -0.221925
ACTA2   3.197873e-122             0.607594
ACTG2    1.876882e-04             0.064398
ADAM9    1.435174e-80            -0.299489
ADGRE5   1.094345e-71             0.639369
...               ...                  ...
VWF      6.573223e-44             0.563628
WARS     1.382161e-01             0.042594
ZEB1    9.170579e-162             1.489268
ZEB2    3.456602e-202             1.879130
ZNF562   2.170897e-18            -0.188773

[297 rows x 10 columns], 'ref_neighborhood':         n_target_cells  n_cells_used  n_cells_expressed  mean_target  \
gene
ABCC11           31016         17879              14751     1.211318
ACTA2            31016         17879               9639     0.525261
ACTG2            31016         17879              13011     0.858179
ADAM9            31016         17879              12893     0.852588
ADGRE5           31016         17879                446     0.018370
...                ...           ...                ...          ...
VWF              31016         17879               1830     0.079330
WARS             31016         17879               8557     0.440672
ZEB1             31016         17879               1116     0.049014
ZEB2             31016         17879               2163     0.095106
ZNF562           31016         17879              11201     0.646623

        mean_neighbor  log2foldchange  log2foldchange_unpaired         pvalue  \
gene
ABCC11       0.665242        0.787822                 1.319181   0.000000e+00
ACTA2        1.005323       -0.692584                -1.326549   0.000000e+00
ACTG2        0.854385        0.005473                 0.009515   3.502186e-01
ADAM9        0.799903        0.076008                 0.135203   3.145965e-19
ADGRE5       0.143971       -0.181204                -3.062200   0.000000e+00
...               ...             ...                      ...            ...
VWF          0.277080       -0.285294                -1.951254   0.000000e+00
WARS         0.463612       -0.033096                -0.091005   2.581637e-06
ZEB1         0.330657       -0.406326                -2.963661   0.000000e+00
ZEB2         0.623493       -0.762302                -3.116667   0.000000e+00
ZNF562       0.482131        0.237311                 0.553255  1.573691e-189

                 padj  contamination_score
gene
ABCC11   0.000000e+00            -0.600786
ACTA2    0.000000e+00             1.107672
ACTG2    3.586721e-01            -0.005712
ADAM9    3.893131e-19            -0.079791
ADGRE5   0.000000e+00             1.530831
...               ...                  ...
VWF      0.000000e+00             1.590893
WARS     2.808594e-06             0.061213
ZEB1     0.000000e+00             2.726766
ZEB2     0.000000e+00             3.907118
ZNF562  3.595280e-189            -0.317846

[297 rows x 10 columns]}
Interpretation patterns:
When neighborhood analysis is enabled (consider_neighbors=True):
Target vs Reference ( |
Target vs Neighbors ( |
Reference vs Neighbors ( |
Interpretation |
|---|---|---|---|
Upregulated (sig.) |
Upregulated or NS |
Any |
Genuine upregulation |
Upregulated (sig.) |
Downregulated (sig.) |
Any |
Possible contamination in target cells |
Downregulated (sig.) |
Any |
Downregulated (sig.) |
Possible contamination in reference cells |
Downregulated (sig.) |
Any |
Upregulated or NS |
Genuine downregulation |
Saving and loading results:
from insitupy.dataclasses.results import DiffExprResults

# Save complete analysis
dge_results.save("out/dge_results", overwrite=True)

# Load saved results
dge_results_reloaded = DiffExprResults.read("out/dge_results")

# Quick summary
print(dge_results_reloaded.summary())
Warning: Overwriting existing directory 'out\dge_results'.
Main DGE results: 297 genes
Neighbor comparison (A): 297 genes
Neighbor comparison (B): 297 genes
Configuration:
<bound method DiffExprConfigCollector.__repr__ of DiffExprConfigCollector(
  General:
    mode: single-cell
    method_params: {'groupby': 'DGE_COMPARISON_COLUMN', 'reference': 'REFERENCE', 'method': 'wilcoxon', 'use_raw': False, 'corr_method': 'benjamini-hochberg'}
    cells_layer: None
    exclude_ambiguous_assignments: True
  Target:
    annotation: None
    cell_type: Breast cancer subtype 4
    region: None
    cell_number: 6445
    name: None
    metadata: None
  Reference:
    annotation: None
    cell_type: Breast cancer subtype 1
    region: None
    cell_number: 31016
    name: None
    metadata: None
)>
Visualization#
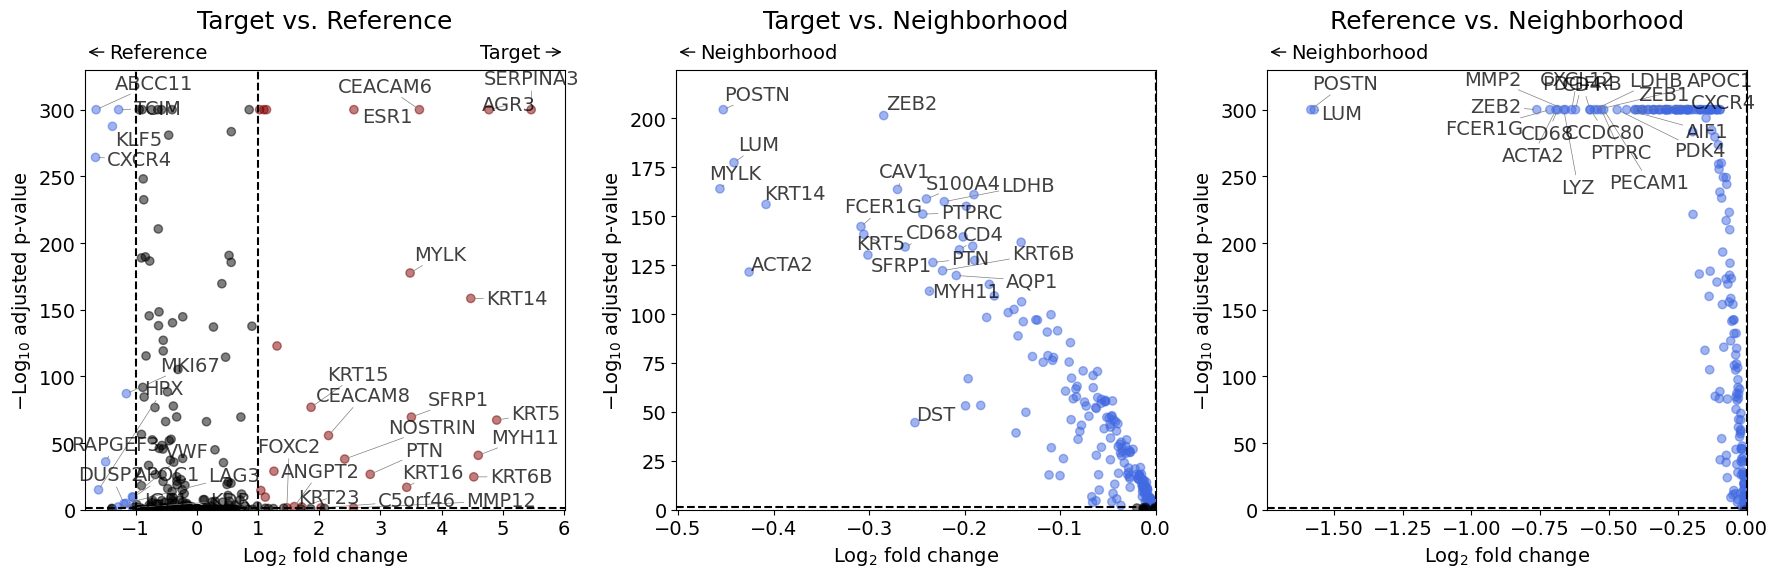
Volcano Plot#
Standard visualization showing significance vs fold change.
from insitupy.plotting import dual_foldchange_plot, volcano
volcano(dge_results)
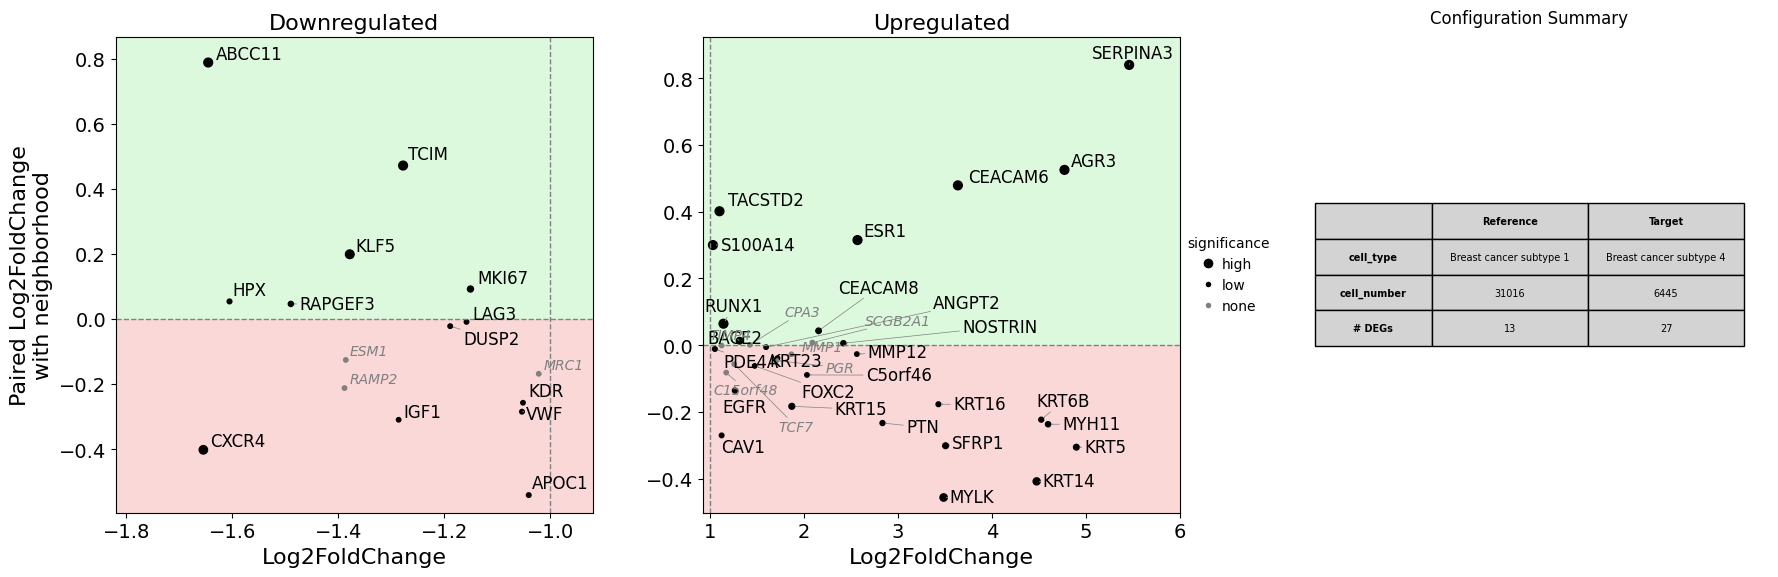
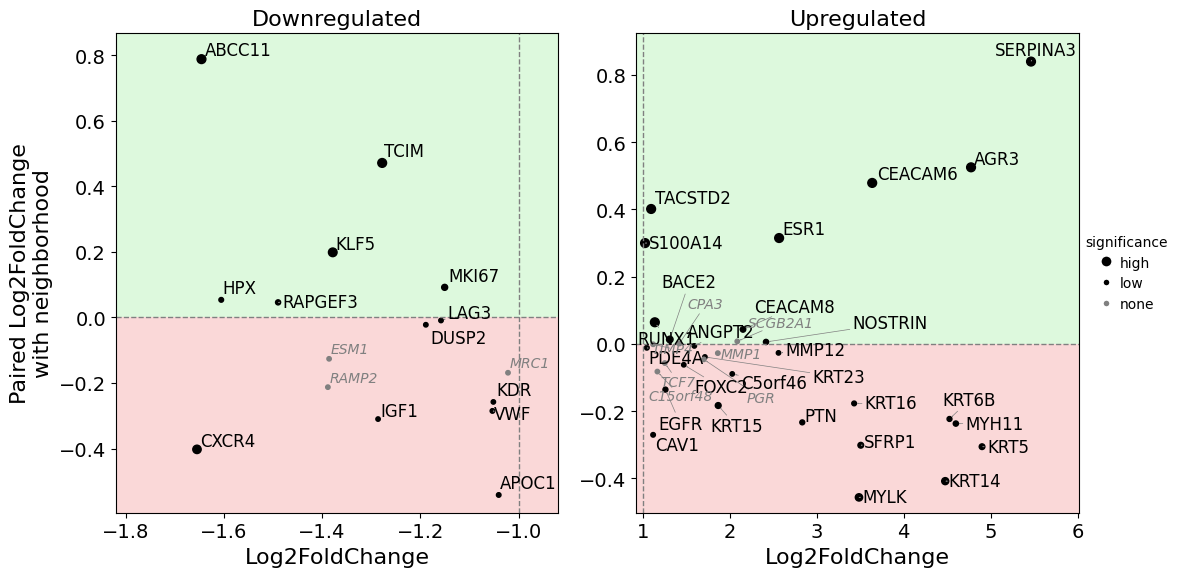
Dual Fold Change Plot - Key visualization for contamination-aware differential gene expression analysis#
Plots standard DGE (x-axis) against neighborhood contamination (y-axis) for both target and reference populations:
Target panel (left):
Upper half: Target cells express more than their neighbors → genuine expression
Lower half: Target cells express less than their neighbors → potential contamination from neighbors
Reference panel (right):
Upper half: Reference cells express more than their neighbors → genuine expression
Lower half: Reference cells express less than their neighbors → potential contamination from neighbors
Interpretation:
Genes in upper-right of target panel + positive main DGE: Genuine upregulation in target
Genes in lower-right of target panel + positive main DGE: Likely contamination artifact in target
Genes in upper-right of reference panel + negative main DGE: Genuine upregulation in reference (= downregulation in target)
dual_foldchange_plot(
    dge_results,
    foldchange_threshold=2,
    adjust_labels=True,
    size_by_pvalue=True,
    show_nonsignificant=True
)
Using show_config one can also display more information on the cells used for the differential gene expression analysis. The savepath argument can be used to save the plot.
dual_foldchange_plot(
    dge_results,
    foldchange_threshold=2,
    adjust_labels=True,
    size_by_pvalue=True,
    show_nonsignificant=True,
    show_config=True,
    savepath="figures/dual_foldchange_config.pdf"
)