Split datasets#
It can sometimes happen that data from multiple samples is present in one spatial omics dataset. E.g. the Xenium In Situ technology only allows the selection of maximum 8 tissue sections during the run, resulting in multiple samples having to be combined in one dataset, if more than 8 samples are on one slide. Another example are tissue microarrays where each core represents a different sample and usually far more than 8 samples are placed on one slide. This notebook shows a workflow how to split such datasets into its individual samples and structure them as InSituExperiment object.
## The following code ensures that all functions and init files are reloaded before executions.
%load_ext autoreload
%autoreload 2
As an example dataset we use the human breast cancer Xenium datasets. It does not contain multiple samples but we will assume in the following that it does and show how to separate them.
from insitupy.datasets import human_breast_cancer
hbreast = human_breast_cancer()
hbreast.load_all()
This dataset exists already. Download is skipped. To force download set `overwrite=True`.
Image exists. Checking md5sum...
The md5sum matches. Download is skipped. To force download set `overwrite=True`.
Image exists. Checking md5sum...
The md5sum matches. Download is skipped. To force download set `overwrite=True`.
Corresponding image data can be found in C:\Users\ge37voy\.cache\InSituPy\demo_datasets\hbreastcancer\unregistered_images
For this dataset following images are available:
slide_id__hbreastcancer__HE__histo.ome.tiff
slide_id__hbreastcancer__CD20_HER2_DAPI__IF.ome.tiff
Loading cells...
Loading images...
Loading transcripts...
hbreast
InSituData
Method:		Xenium
Slide ID:	0001879
Sample ID:	Replicate 1
Path:		C:\Users\ge37voy\.cache\InSituPy\demo_datasets\hbreastcancer\output-XETG00000__slide_id__hbreastcancer

    ➤ images
       nuclei:	(25778, 35416)
    ➤ cells
       MultiCellData with main layer 'main'
           matrix
               AnnData object with n_obs × n_vars = 167780 × 313
               obs: 'transcript_counts', 'control_probe_counts', 'control_codeword_counts', 'total_counts', 'cell_area', 'nucleus_area'
               var: 'gene_ids', 'feature_types', 'genome'
               obsm: 'spatial'
           boundaries
               BoundariesData object with 2 entries:
                   cells
                   nuclei
    ➤ transcripts
       DataFrame with shape <dask_expr.expr.Scalar: expr=ReadParquetFSSpec(8c76d47).size() // 8, dtype=int64> x 8
Visualize the data to select the individual samples#
hbreast.show()
INFO: Added 1 new regions to key 'Samples'
INFO: Added 1 new regions to existing key 'Samples'
Add regions#
Manually#
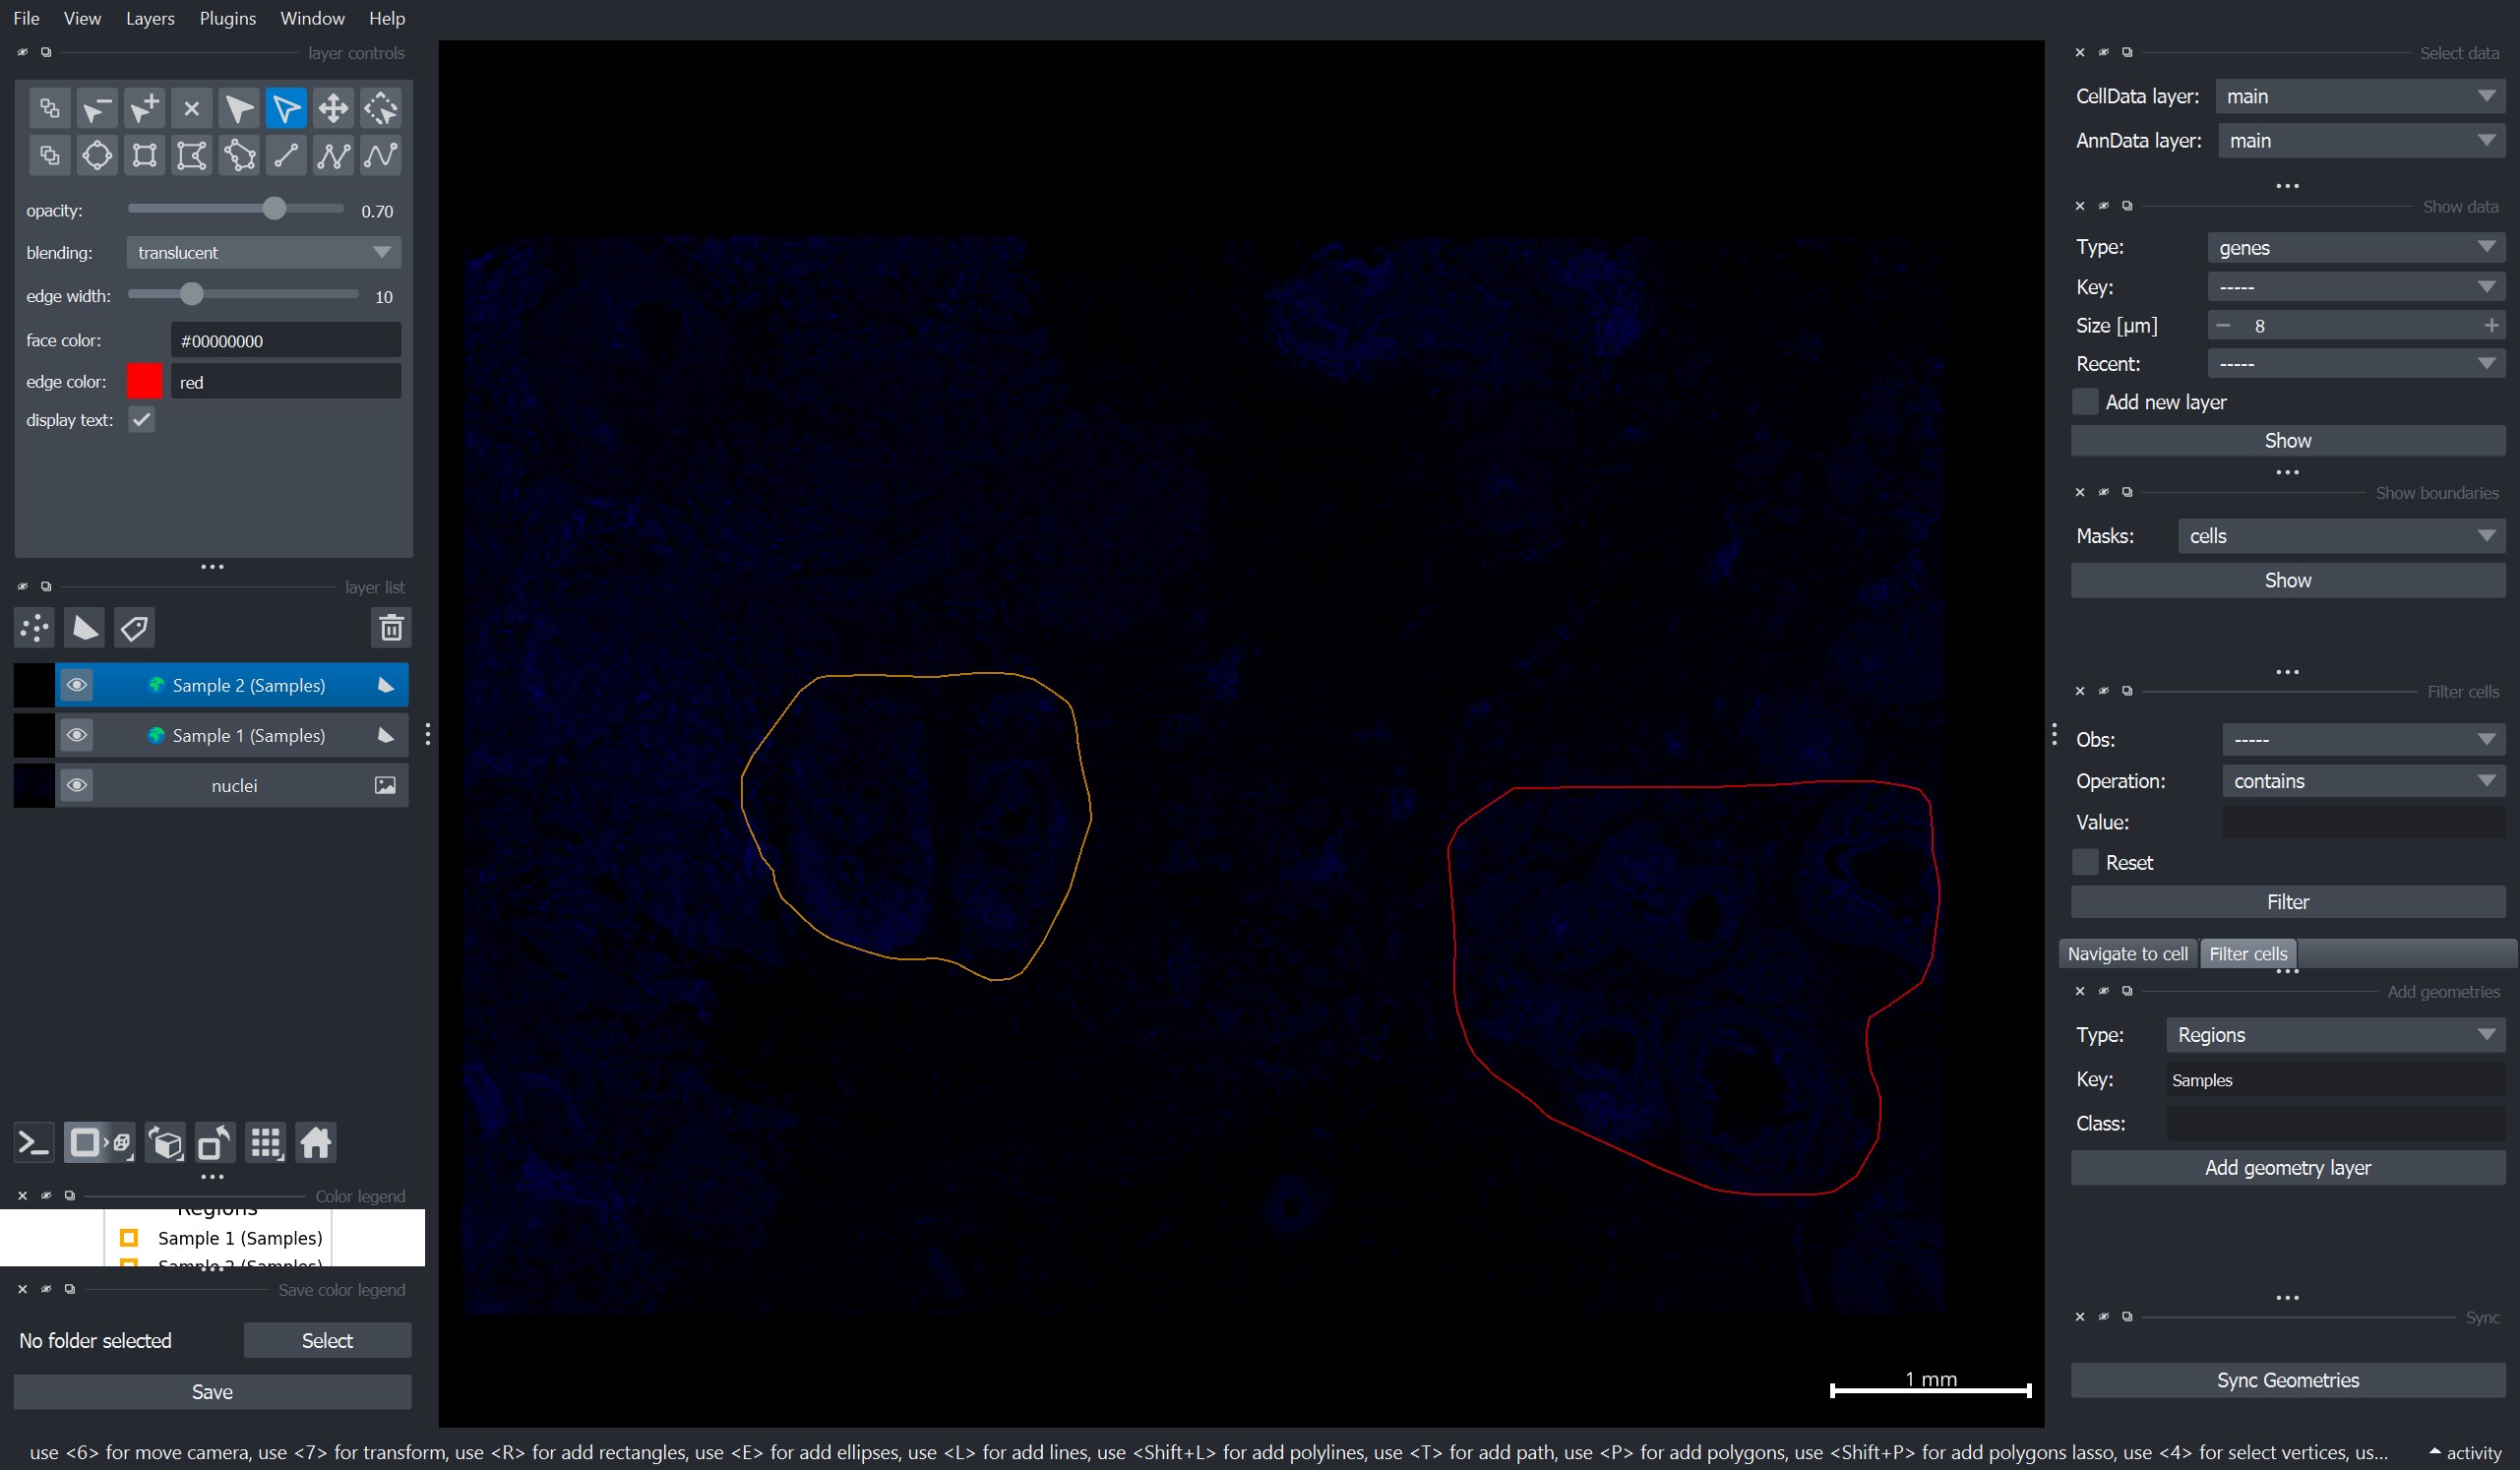
To add regions, one can use the “Add geometries” widget on the right side of the napari window:
Select Type = “Regions”
Add a Key value and a Class name (here we use
"Samples"for the key and"Sample 1/2"as class names for the two samples)Press Add geometry layer
Add one rectangle per region layer. !!! Important: Per region layer only one shape is allowed.
Repeat this for all regions.
Click “Sync Geometries” on the bottom right of the window to import the regions into the
InSituDataobject.
Here is an example screenshot of how the viewer might look at this stage:
Alternatively: Import regions from file#
Alternatively, to manually creating the regions, one can also use the import_annotations function as described in this notebooek, allowing the import from many regions from e.g. QuPath. This is especially important for cases like tissue microarrays where QuPath offers functions to automatically recognize the position of the individual cores.
hbreast
InSituData
Method:		Xenium
Slide ID:	0001879
Sample ID:	Replicate 1
Path:		C:\Users\ge37voy\.cache\InSituPy\demo_datasets\hbreastcancer\output-XETG00000__slide_id__hbreastcancer

    ➤ images
       nuclei:	(25778, 35416)
    ➤ cells
       MultiCellData with main layer 'main'
           matrix
               AnnData object with n_obs × n_vars = 167780 × 313
               obs: 'transcript_counts', 'control_probe_counts', 'control_codeword_counts', 'total_counts', 'cell_area', 'nucleus_area'
               var: 'gene_ids', 'feature_types', 'genome'
               obsm: 'spatial'
           boundaries
               BoundariesData object with 2 entries:
                   cells
                   nuclei
    ➤ transcripts
       DataFrame with shape <dask_expr.expr.Scalar: expr=ReadParquetFSSpec(8c76d47).size() // 8, dtype=int64> x 8
    ➤ regions
       Samples:	2 regions, 2 classes ('Sample 1', 'Sample 2')
Create an InSituExperiment object using the annotated regions#
from insitupy import InSituExperiment
exp = InSituExperiment.from_regions(
    data=hbreast, region_key="Samples"
)
Sample 1
Sample 2
exp
InSituExperiment with 2 samples:
           uid  CITAR slide_id    sample_id region_key region_name
0     da003f97  +++-+  0001879  Replicate 1    Samples    Sample 1
1     9ea967a8  +++-+  0001879  Replicate 1    Samples    Sample 2
Save the data#
exp.saveas("out/split_data_by_region")
Reload data#
Reloading the data from a saved InSituExperiment projects increases the performance for visualization, etc.
exp = InSituExperiment.read("out/split_data_by_region/")
exp.load_all()
exp
InSituExperiment with 2 samples:
           uid  CITAR  slide_id    sample_id region_key region_name
0     da003f97  +++-+      1879  Replicate 1    Samples    Sample 1
1     9ea967a8  +++-+      1879  Replicate 1    Samples    Sample 2
exp.show(0)
INFO: New layer '🌍 Sample 1 (Samples)' created.
How to work with multi-sample data (e.g. how to combine this data now with more other samples) is explained in this notebook.