Introduction to the InSituExperiment class#
Background#
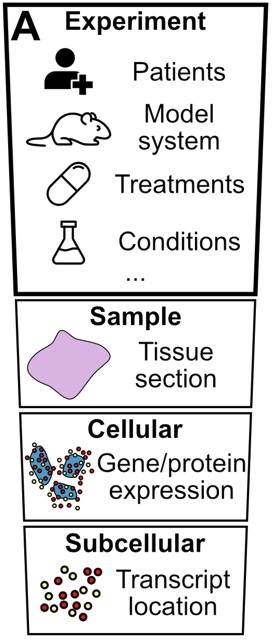
In addition to the sample, cellular, and subcellular levels, a spatial transcriptomics dataset typically includes an experiment level that contains information about clinical and experimental cohorts, conditions, or treatments. Most current computational frameworks lack functionalities to incorporate this level into the analysis. To address this, InSituPy introduces the InSituExperiment class, which manages spatial transcriptomics data and the corresponding metadata of multiple samples simultaneously.
Structure#
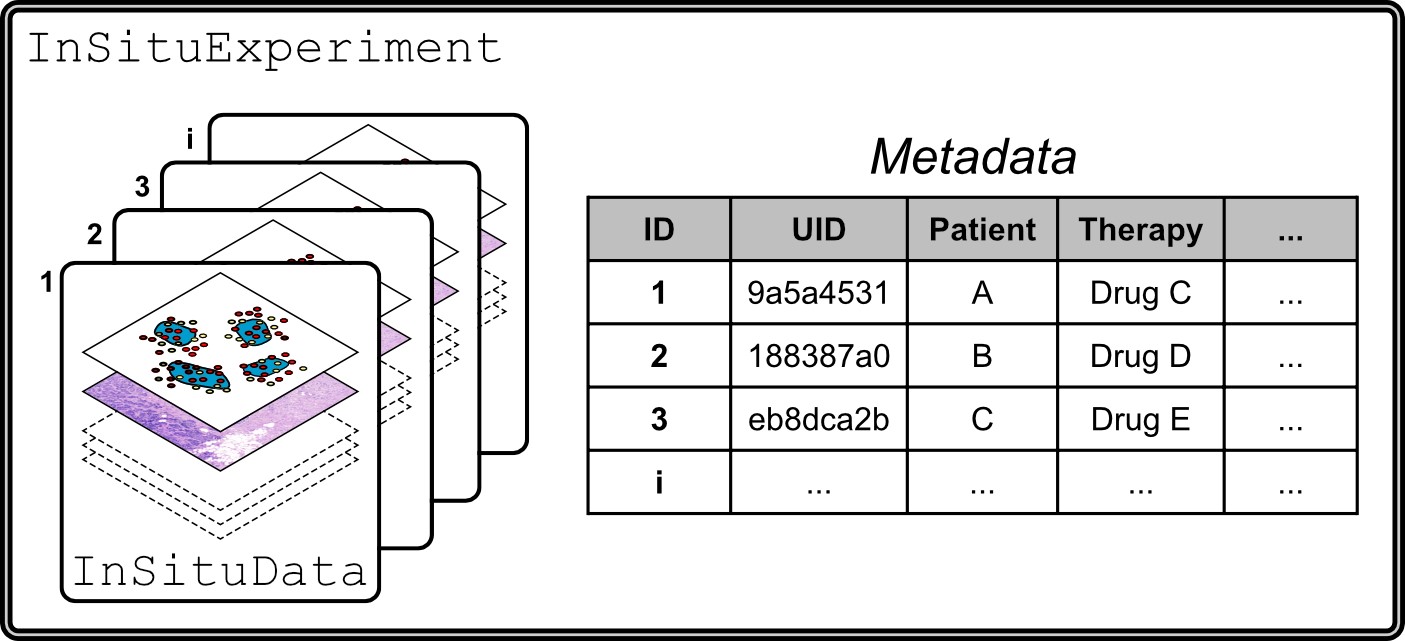
An InSituExperiment object consists of multiple InSituData objects paired with their corresponding metadata.
## The following code ensures that all functions and init files are reloaded before executions.
%load_ext autoreload
%autoreload 2
from pathlib import Path
from insitupy import InSituData, InSituExperiment, CACHE
import warnings
warnings.simplefilter(action='ignore', category=FutureWarning)
Load Xenium data into InSituData object#
Now the Xenium data can be parsed by providing the data path to the InSituPy project folder.
insitupy_project = Path(CACHE / "out/demo_insitupy_project")
xd = InSituData.read(insitupy_project)
xd.load_all(skip="transcripts")
xd
InSituData
Method:		Xenium
Slide ID:	0001879
Sample ID:	Replicate 1
Path:		C:\Users\ge37voy\.cache\InSituPy\out\demo_insitupy_project

    ➤ images
       CD20:	(25778, 35416)
       HE:	(25778, 35416, 3)
       HER2:	(25778, 35416)
       nuclei:	(25778, 35416)
    ➤ cells
       MultiCellData with main layer 'main'
           matrix
               AnnData object with n_obs × n_vars = 156447 × 297
               obs: 'transcript_counts', 'control_probe_counts', 'control_codeword_counts', 'total_counts', 'cell_area', 'nucleus_area', 'n_genes_by_counts', 'n_genes', 'leiden', 'cell_type_dc', 'cell_type_dc_sub', 'cell_type_tacco', 'cell_type_publ'
               var: 'gene_ids', 'feature_types', 'genome', 'n_cells_by_counts', 'mean_counts', 'pct_dropout_by_counts', 'total_counts', 'n_cells'
               uns: 'cell_type_dc_colors', 'cell_type_dc_sub', 'cell_type_dc_sub_colors', 'cell_type_publ_colors', 'cell_type_tacco_colors', 'counts_location', 'leiden', 'leiden_colors', 'log1p', 'neighbors', 'pca', 'umap'
               obsm: 'OT', 'X_pca', 'X_umap', 'annotations', 'ora_estimate', 'ora_pvals', 'regions', 'spatial'
               varm: 'OT', 'PCs'
               layers: 'counts', 'norm_counts'
               obsp: 'connectivities', 'distances'
           boundaries
               BoundariesData object with 2 entries:
                   cells
                   nuclei
    ➤ annotations
       TestKey:	5 annotations, 2 classes ('TestClass', 'test') ✔
       demo:	28 annotations, 2 classes ('Stroma', 'Tumor cells') ✔
       demo2:	5 annotations, 3 classes ('Negative', 'Other', 'Positive') ✔
       demo3:	7 annotations, 5 classes ('Immune cells', 'Necrosis', 'Stroma', 'Tumor', 'unclassified') ✔
       Demo:	28 annotations, 2 classes ('Stroma', 'Tumor cells') ✔
    ➤ regions
       demo_regions:	3 regions, 3 classes ('Region1', 'Region2', 'Region3') ✔
       TMA:	6 regions, 6 classes ('A-1', 'A-2', 'A-3', 'B-1', 'B-2', 'B-3') ✔
       Demo:	3 regions, 3 classes ('Region 1', 'Region 2', 'Region 3') ✔
Create InSituExperiment#
Options to generate an InSituExperiment object
Method 1: Manually add InSituData objects#
exp = InSituExperiment()
exp.add(
    data=xd,
    metadata={
        "slide_id": xd.slide_id,
        "sample_id": xd.sample_id,
        "patient": "A"
    }
    )
exp
InSituExperiment with 1 samples:
           uid  CITAR slide_id    sample_id patient
0     9f3f7f9b  ++-++  0001879  Replicate 1       A
In the same way also other datasets can be added. For demonstration purposes, we just add the same dataset again and change the metadata.
exp.add(
    data=xd,
    metadata={
        "slide_id": xd.slide_id,
        "sample_id": xd.sample_id,
        "patient": "A",
        "therapy": "drugB"
    }
    )
exp
InSituExperiment with 2 samples:
           uid  CITAR slide_id    sample_id patient therapy
0     9f3f7f9b  ++-++  0001879  Replicate 1       A     NaN
1     106c2b98  ++-++  0001879  Replicate 1       A   drugB
Method 2: From config file#
As config file either a csv file or an excel file can be used.
Example of a valid configuration file:
directory |
experiment_name |
date |
patient |
|---|---|---|---|
/path/to/dataset1 |
Experiment 1 |
2023-09-01 |
Patient A |
/path/to/dataset2 |
Experiment 2 |
2023-09-02 |
Patient B |
import pandas as pd
from insitupy import CACHE

# Define the data
data = {
    "directory": [f"{CACHE}\\out\\demo_insitupy_project", f"{CACHE}\\out\\demo_insitupy_project"],
    "patient": ["A", "B"],
    "therapy": ["drugA", "drugB"]
}

# Create a DataFrame
config_df = pd.DataFrame(data)

# Write the DataFrame to a CSV file
config_df.to_csv('../../demo_data/demo_experiment/insituexperiment_config.csv', index=False)
exp = InSituExperiment.from_config(config_path="../../demo_data/demo_experiment/insituexperiment_config.csv")
exp
InSituExperiment with 2 samples:
           uid  CITAR slide_id    sample_id patient therapy
0     e70130ba  -----  0001879  Replicate 1       A   drugA
1     b6bcb5d2  -----  0001879  Replicate 1       B   drugB
exp.load_all()
exp
InSituExperiment with 2 samples:
           uid  CITAR slide_id    sample_id patient therapy
0     e70130ba  +++++  0001879  Replicate 1       A   drugA
1     b6bcb5d2  +++++  0001879  Replicate 1       B   drugB
Method 3: From regions#
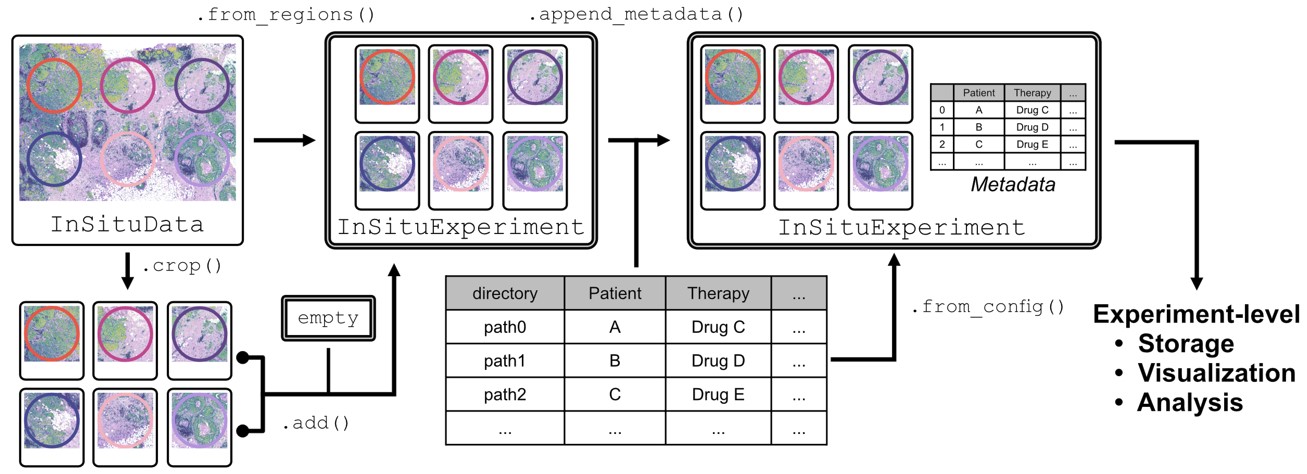
We can also use regions from an InSituData object to split the data into separate datasets and create an InSituExperiment from them. This can be used to select the most interesting regions and focus on them for the analysis or to split a TMA dataset into separate datasets for each core.
exp = InSituExperiment.from_regions(
    data=xd, region_key="TMA"
)
A-1
A-2
A-3
B-1
B-2
B-3
exp
InSituExperiment with 6 samples:
           uid  CITAR slide_id    sample_id region_key region_name
0     d5933ddc  ++-++  0001879  Replicate 1        TMA         A-1
1     a2e80cc4  ++--+  0001879  Replicate 1        TMA         A-2
2     48ac6b5f  ++--+  0001879  Replicate 1        TMA         A-3
3     9c6648b2  ++-++  0001879  Replicate 1        TMA         B-1
4     4119649d  ++-++  0001879  Replicate 1        TMA         B-2
5     b56cbd06  ++-++  0001879  Replicate 1        TMA         B-3
Work with viewer windows and InSituExperiment#
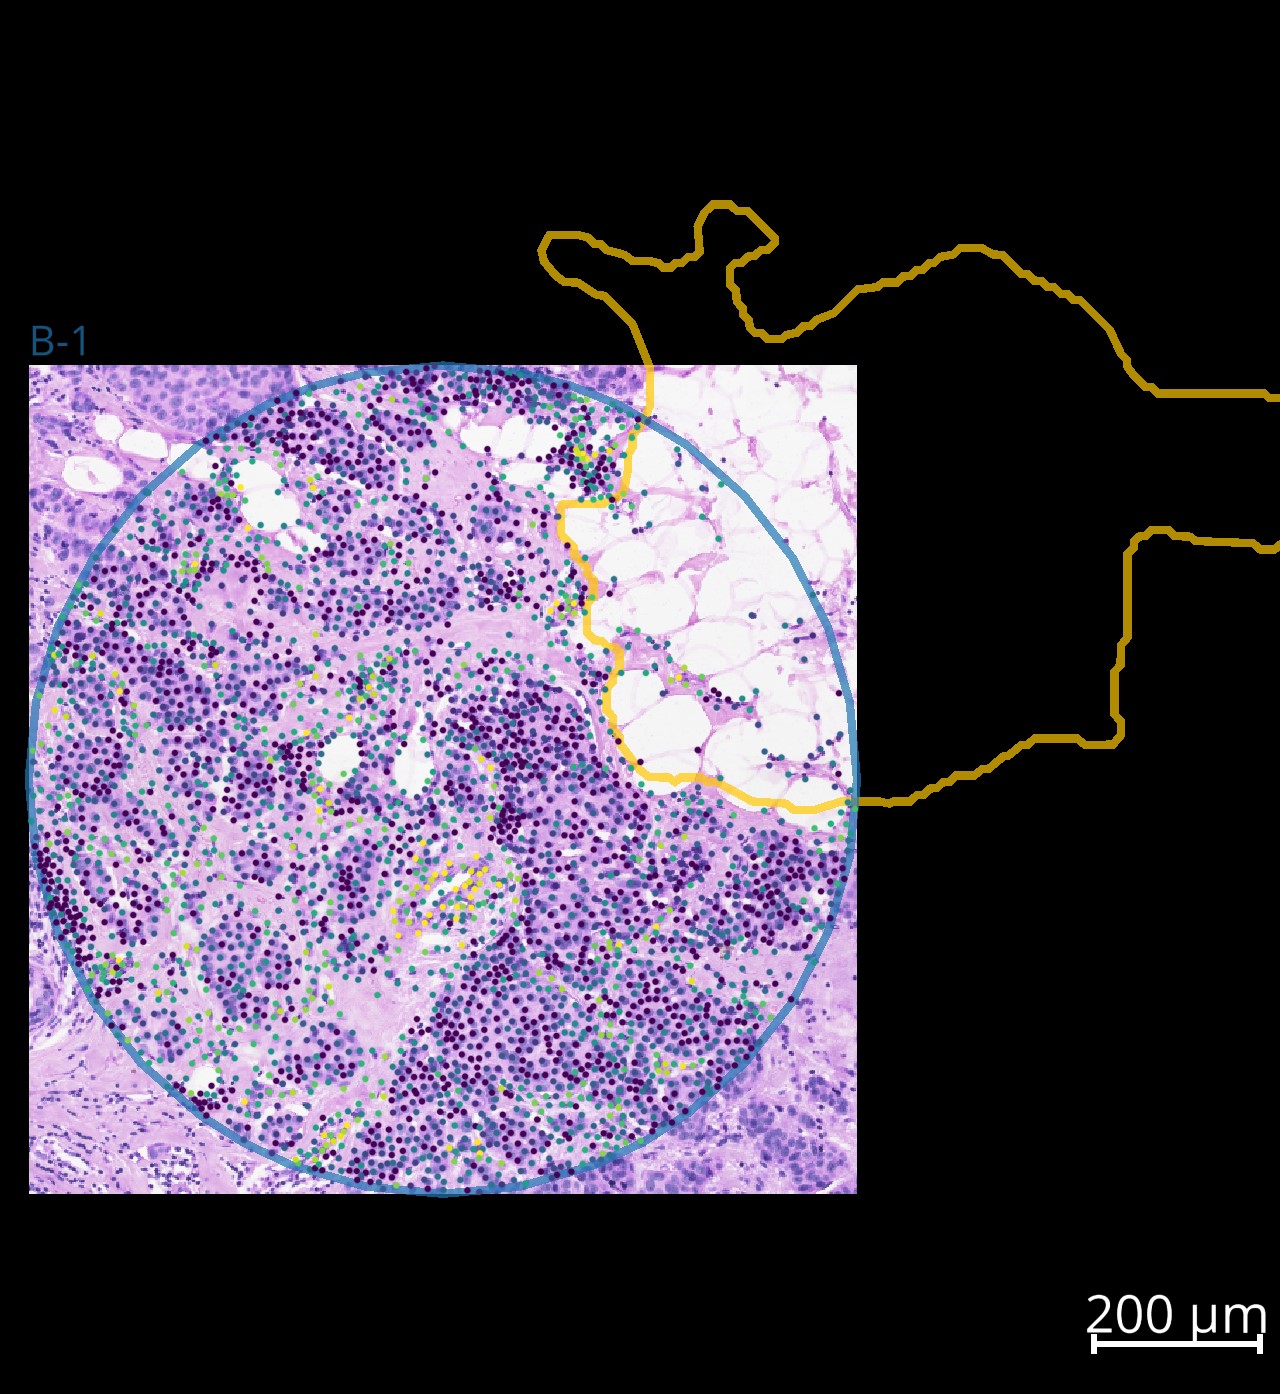
One can interactively display the data for individual datasets inside an InSituExperiment using .show(<index>), where <index> specifies the index of the data in the metadata. Since version 0.9.0 multiple viewer windows can be opened in parallel. In the napari window annotations can be made and synced back to the data in InSituExperiment using the “Sync Geometries” button on the bottom right.
# visualize data
exp.show(3)
Example screenshot of data from one of the cropped cores:
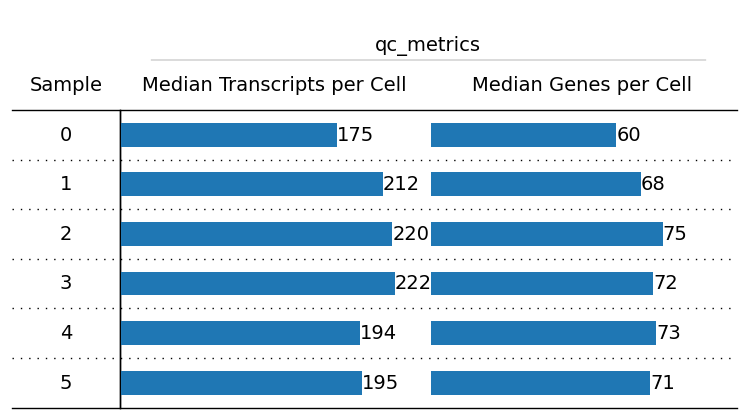
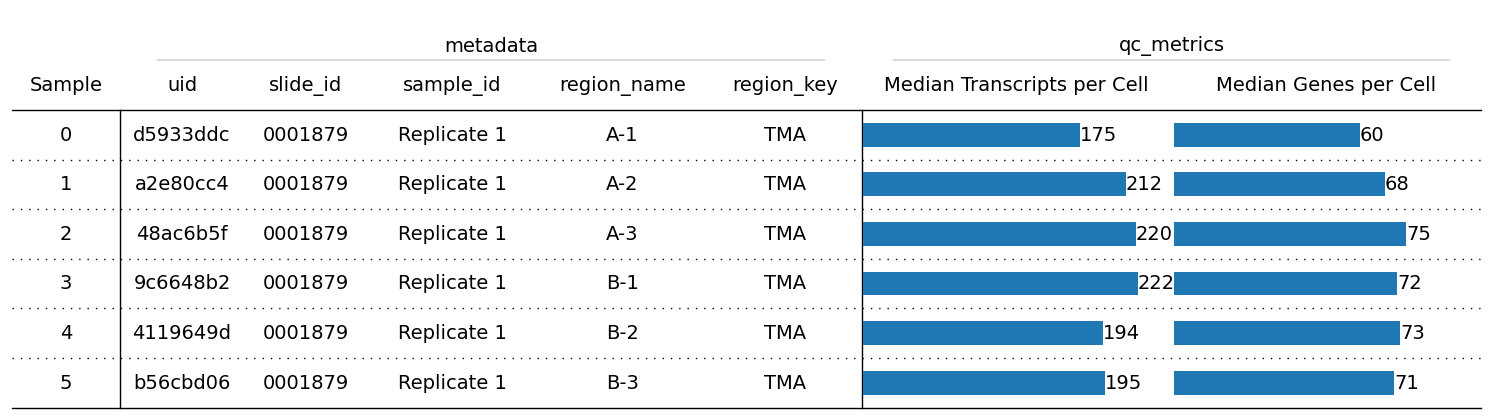
Plot overview of metadata and QC metrics#
from insitupy.plotting import overview
overview(exp)
overview(exp, cells_layer="main", columns_to_plot=["uid", "slide_id", "sample_id", "region_name", "region_key"], index=True)
Iterate through InSituExperiment#
The .iterdata() method returns a generator object, allowing you to iterate through the metadata and data of each dataset in the InSituExperiment. The individual datasets are returned as InSituData objects.
for metadata, data in exp.iterdata():
    print(f"Metadata:\n{metadata[:3]}\nData:\n{data}")
Metadata:
uid             d5933ddc
slide_id         0001879
sample_id    Replicate 1
Name: 0, dtype: object
Data:
InSituData
Method:		Xenium
Slide ID:	0001879
Sample ID:	Replicate 1
Path:		None

    ➤ images
       CD20:	(4706, 4706)
       HE:	(4706, 4706, 3)
       HER2:	(4706, 4706)
       nuclei:	(4706, 4706)
    ➤ cells
       MultiCellData with main layer 'main'
           matrix
               AnnData object with n_obs × n_vars = 4847 × 297
               obs: 'transcript_counts', 'control_probe_counts', 'control_codeword_counts', 'total_counts', 'cell_area', 'nucleus_area', 'n_genes_by_counts', 'n_genes', 'leiden', 'cell_type_dc', 'cell_type_dc_sub', 'cell_type_tacco', 'cell_type_publ'
               var: 'gene_ids', 'feature_types', 'genome', 'n_cells_by_counts', 'mean_counts', 'pct_dropout_by_counts', 'total_counts', 'n_cells'
               uns: 'cell_type_dc_colors', 'cell_type_dc_sub', 'cell_type_dc_sub_colors', 'cell_type_publ_colors', 'cell_type_tacco_colors', 'counts_location', 'leiden', 'leiden_colors', 'log1p', 'neighbors', 'pca', 'umap'
               obsm: 'OT', 'X_pca', 'X_umap', 'annotations', 'ora_estimate', 'ora_pvals', 'regions', 'spatial'
               varm: 'OT', 'PCs'
               layers: 'counts', 'norm_counts'
               obsp: 'connectivities', 'distances'
           boundaries
               BoundariesData object with 2 entries:
                   cells
                   nuclei
    ➤ annotations
       demo:	4 annotations, 2 classes ('Stroma', 'Tumor cells')
       Demo:	4 annotations, 2 classes ('Stroma', 'Tumor cells')
    ➤ regions
       TMA:	1 regions, 1 class ('A-1')
       Demo:	1 regions, 1 class ('Region 1')
Metadata:
uid             a2e80cc4
slide_id         0001879
sample_id    Replicate 1
Name: 1, dtype: object
Data:
InSituData
Method:		Xenium
Slide ID:	0001879
Sample ID:	Replicate 1
Path:		None

    ➤ images
       CD20:	(4706, 4705)
       HE:	(4706, 4705, 3)
       HER2:	(4706, 4705)
       nuclei:	(4706, 4705)
    ➤ cells
       MultiCellData with main layer 'main'
           matrix
               AnnData object with n_obs × n_vars = 1766 × 297
               obs: 'transcript_counts', 'control_probe_counts', 'control_codeword_counts', 'total_counts', 'cell_area', 'nucleus_area', 'n_genes_by_counts', 'n_genes', 'leiden', 'cell_type_dc', 'cell_type_dc_sub', 'cell_type_tacco', 'cell_type_publ'
               var: 'gene_ids', 'feature_types', 'genome', 'n_cells_by_counts', 'mean_counts', 'pct_dropout_by_counts', 'total_counts', 'n_cells'
               uns: 'cell_type_dc_colors', 'cell_type_dc_sub', 'cell_type_dc_sub_colors', 'cell_type_publ_colors', 'cell_type_tacco_colors', 'counts_location', 'leiden', 'leiden_colors', 'log1p', 'neighbors', 'pca', 'umap'
               obsm: 'OT', 'X_pca', 'X_umap', 'annotations', 'ora_estimate', 'ora_pvals', 'regions', 'spatial'
               varm: 'OT', 'PCs'
               layers: 'counts', 'norm_counts'
               obsp: 'connectivities', 'distances'
           boundaries
               BoundariesData object with 2 entries:
                   cells
                   nuclei
    ➤ regions
       TMA:	1 regions, 1 class ('A-2')
Metadata:
uid             48ac6b5f
slide_id         0001879
sample_id    Replicate 1
Name: 2, dtype: object
Data:
InSituData
Method:		Xenium
Slide ID:	0001879
Sample ID:	Replicate 1
Path:		None

    ➤ images
       CD20:	(4706, 4705)
       HE:	(4706, 4705, 3)
       HER2:	(4706, 4705)
       nuclei:	(4706, 4705)
    ➤ cells
       MultiCellData with main layer 'main'
           matrix
               AnnData object with n_obs × n_vars = 1807 × 297
               obs: 'transcript_counts', 'control_probe_counts', 'control_codeword_counts', 'total_counts', 'cell_area', 'nucleus_area', 'n_genes_by_counts', 'n_genes', 'leiden', 'cell_type_dc', 'cell_type_dc_sub', 'cell_type_tacco', 'cell_type_publ'
               var: 'gene_ids', 'feature_types', 'genome', 'n_cells_by_counts', 'mean_counts', 'pct_dropout_by_counts', 'total_counts', 'n_cells'
               uns: 'cell_type_dc_colors', 'cell_type_dc_sub', 'cell_type_dc_sub_colors', 'cell_type_publ_colors', 'cell_type_tacco_colors', 'counts_location', 'leiden', 'leiden_colors', 'log1p', 'neighbors', 'pca', 'umap'
               obsm: 'OT', 'X_pca', 'X_umap', 'annotations', 'ora_estimate', 'ora_pvals', 'regions', 'spatial'
               varm: 'OT', 'PCs'
               layers: 'counts', 'norm_counts'
               obsp: 'connectivities', 'distances'
           boundaries
               BoundariesData object with 2 entries:
                   cells
                   nuclei
    ➤ regions
       TMA:	1 regions, 1 class ('A-3')
Metadata:
uid             9c6648b2
slide_id         0001879
sample_id    Replicate 1
Name: 3, dtype: object
Data:
InSituData
Method:		Xenium
Slide ID:	0001879
Sample ID:	Replicate 1
Path:		None

    ➤ images
       CD20:	(4706, 4706)
       HE:	(4706, 4706, 3)
       HER2:	(4706, 4706)
       nuclei:	(4706, 4706)
    ➤ cells
       MultiCellData with main layer 'main'
           matrix
               AnnData object with n_obs × n_vars = 3569 × 297
               obs: 'transcript_counts', 'control_probe_counts', 'control_codeword_counts', 'total_counts', 'cell_area', 'nucleus_area', 'n_genes_by_counts', 'n_genes', 'leiden', 'cell_type_dc', 'cell_type_dc_sub', 'cell_type_tacco', 'cell_type_publ'
               var: 'gene_ids', 'feature_types', 'genome', 'n_cells_by_counts', 'mean_counts', 'pct_dropout_by_counts', 'total_counts', 'n_cells'
               uns: 'cell_type_dc_colors', 'cell_type_dc_sub', 'cell_type_dc_sub_colors', 'cell_type_publ_colors', 'cell_type_tacco_colors', 'counts_location', 'leiden', 'leiden_colors', 'log1p', 'neighbors', 'pca', 'umap'
               obsm: 'OT', 'X_pca', 'X_umap', 'annotations', 'ora_estimate', 'ora_pvals', 'regions', 'spatial'
               varm: 'OT', 'PCs'
               layers: 'counts', 'norm_counts'
               obsp: 'connectivities', 'distances'
           boundaries
               BoundariesData object with 2 entries:
                   cells
                   nuclei
    ➤ annotations
       TestKey:	1 annotations, 1 class ('test')
       demo2:	1 annotations, 1 class ('Other')
    ➤ regions
       TMA:	1 regions, 1 class ('B-1')
Metadata:
uid             4119649d
slide_id         0001879
sample_id    Replicate 1
Name: 4, dtype: object
Data:
InSituData
Method:		Xenium
Slide ID:	0001879
Sample ID:	Replicate 1
Path:		None

    ➤ images
       CD20:	(4706, 4706)
       HE:	(4706, 4706, 3)
       HER2:	(4706, 4706)
       nuclei:	(4706, 4706)
    ➤ cells
       MultiCellData with main layer 'main'
           matrix
               AnnData object with n_obs × n_vars = 2301 × 297
               obs: 'transcript_counts', 'control_probe_counts', 'control_codeword_counts', 'total_counts', 'cell_area', 'nucleus_area', 'n_genes_by_counts', 'n_genes', 'leiden', 'cell_type_dc', 'cell_type_dc_sub', 'cell_type_tacco', 'cell_type_publ'
               var: 'gene_ids', 'feature_types', 'genome', 'n_cells_by_counts', 'mean_counts', 'pct_dropout_by_counts', 'total_counts', 'n_cells'
               uns: 'cell_type_dc_colors', 'cell_type_dc_sub', 'cell_type_dc_sub_colors', 'cell_type_publ_colors', 'cell_type_tacco_colors', 'counts_location', 'leiden', 'leiden_colors', 'log1p', 'neighbors', 'pca', 'umap'
               obsm: 'OT', 'X_pca', 'X_umap', 'annotations', 'ora_estimate', 'ora_pvals', 'regions', 'spatial'
               varm: 'OT', 'PCs'
               layers: 'counts', 'norm_counts'
               obsp: 'connectivities', 'distances'
           boundaries
               BoundariesData object with 2 entries:
                   cells
                   nuclei
    ➤ annotations
       TestKey:	1 annotations, 1 class ('test')
       demo:	1 annotations, 1 class ('Stroma')
       demo2:	1 annotations, 1 class ('Other')
       Demo:	1 annotations, 1 class ('Stroma')
    ➤ regions
       demo_regions:	1 regions, 1 class ('Region3')
       TMA:	1 regions, 1 class ('B-2')
       Demo:	1 regions, 1 class ('Region 2')
Metadata:
uid             b56cbd06
slide_id         0001879
sample_id    Replicate 1
Name: 5, dtype: object
Data:
InSituData
Method:		Xenium
Slide ID:	0001879
Sample ID:	Replicate 1
Path:		None

    ➤ images
       CD20:	(4706, 4706)
       HE:	(4706, 4706, 3)
       HER2:	(4706, 4706)
       nuclei:	(4706, 4706)
    ➤ cells
       MultiCellData with main layer 'main'
           matrix
               AnnData object with n_obs × n_vars = 3405 × 297
               obs: 'transcript_counts', 'control_probe_counts', 'control_codeword_counts', 'total_counts', 'cell_area', 'nucleus_area', 'n_genes_by_counts', 'n_genes', 'leiden', 'cell_type_dc', 'cell_type_dc_sub', 'cell_type_tacco', 'cell_type_publ'
               var: 'gene_ids', 'feature_types', 'genome', 'n_cells_by_counts', 'mean_counts', 'pct_dropout_by_counts', 'total_counts', 'n_cells'
               uns: 'cell_type_dc_colors', 'cell_type_dc_sub', 'cell_type_dc_sub_colors', 'cell_type_publ_colors', 'cell_type_tacco_colors', 'counts_location', 'leiden', 'leiden_colors', 'log1p', 'neighbors', 'pca', 'umap'
               obsm: 'OT', 'X_pca', 'X_umap', 'annotations', 'ora_estimate', 'ora_pvals', 'regions', 'spatial'
               varm: 'OT', 'PCs'
               layers: 'counts', 'norm_counts'
               obsp: 'connectivities', 'distances'
           boundaries
               BoundariesData object with 2 entries:
                   cells
                   nuclei
    ➤ annotations
       demo:	3 annotations, 2 classes ('Stroma', 'Tumor cells')
       demo2:	1 annotations, 1 class ('Negative')
       Demo:	3 annotations, 2 classes ('Stroma', 'Tumor cells')
    ➤ regions
       TMA:	1 regions, 1 class ('B-3')
       Demo:	1 regions, 1 class ('Region 3')
Add new metadata#
In the following section different scenarios for adding new metadata are shown.
exp1 = InSituExperiment.from_regions(
    data=xd, region_key="demo_regions"
)
Region1
Region2
Region3
exp1
InSituExperiment with 3 samples:
           uid  CITAR slide_id    sample_id    region_key region_name
0     0d1f50a5  ++-++  0001879  Replicate 1  demo_regions     Region1
1     16fe63e1  ++-++  0001879  Replicate 1  demo_regions     Region2
2     7900691c  ++-++  0001879  Replicate 1  demo_regions     Region3
exp2 = exp1.copy()
exp2.append_metadata(
    new_metadata="../../demo_data/demo_experiment/insituexperiment_new_metadata.csv",
    by="region_name", overwrite=True
)
exp2
InSituExperiment with 3 samples:
           uid  CITAR slide_id    sample_id region_name therapy   organ      test region_key
0     0d1f50a5  ++-++  0001879  Replicate 1     Region1   drugC   liver  negative       key1
1     16fe63e1  ++-++  0001879  Replicate 1     Region2   drugD    lung      test       key3
2     7900691c  ++-++  0001879  Replicate 1     Region3   drugE  spleen  positive       key2
exp3 = exp1.copy()
exp3.append_metadata(
    new_metadata="../../demo_data/demo_experiment/insituexperiment_new_metadata.csv",
    by="region_name", overwrite=False
)
exp3
InSituExperiment with 3 samples:
           uid  CITAR slide_id    sample_id    region_key region_name   organ      test therapy
0     0d1f50a5  ++-++  0001879  Replicate 1  demo_regions     Region1   liver  negative   drugC
1     16fe63e1  ++-++  0001879  Replicate 1  demo_regions     Region2    lung      test   drugD
2     7900691c  ++-++  0001879  Replicate 1  demo_regions     Region3  spleen  positive   drugE
exp4 = exp1.copy()
exp4.append_metadata(
    new_metadata="../../demo_data/demo_experiment/insituexperiment_new_metadata2.csv",
    by="region_name", overwrite=False
)
exp4
InSituExperiment with 3 samples:
           uid  CITAR slide_id    sample_id    region_key region_name   organ      test therapy
0     0d1f50a5  ++-++  0001879  Replicate 1  demo_regions     Region1   liver  negative   drugC
1     16fe63e1  ++-++  0001879  Replicate 1  demo_regions     Region2     NaN       NaN     NaN
2     7900691c  ++-++  0001879  Replicate 1  demo_regions     Region3  spleen  positive   drugE
exp5 = exp1.copy()
exp5.append_metadata(
    new_metadata="../../demo_data/demo_experiment/insituexperiment_new_metadata2.csv",
    by="region_name", overwrite=True
)
exp5
InSituExperiment with 3 samples:
           uid  CITAR slide_id    sample_id region_name therapy   organ      test region_key
0     0d1f50a5  ++-++  0001879  Replicate 1     Region1   drugC   liver  negative       key1
1     16fe63e1  ++-++  0001879  Replicate 1     Region2     NaN     NaN       NaN        NaN
2     7900691c  ++-++  0001879  Replicate 1     Region3   drugE  spleen  positive       key2
Concatenate multiple InSituExperiment objects
exp
InSituExperiment with 6 samples:
           uid  CITAR slide_id    sample_id region_key region_name
0     d5933ddc  ++-++  0001879  Replicate 1        TMA         A-1
1     a2e80cc4  ++--+  0001879  Replicate 1        TMA         A-2
2     48ac6b5f  ++--+  0001879  Replicate 1        TMA         A-3
3     9c6648b2  ++-++  0001879  Replicate 1        TMA         B-1
4     4119649d  ++-++  0001879  Replicate 1        TMA         B-2
5     b56cbd06  ++-++  0001879  Replicate 1        TMA         B-3
exp1
InSituExperiment with 3 samples:
           uid  CITAR slide_id    sample_id    region_key region_name
0     0d1f50a5  ++-++  0001879  Replicate 1  demo_regions     Region1
1     16fe63e1  ++-++  0001879  Replicate 1  demo_regions     Region2
2     7900691c  ++-++  0001879  Replicate 1  demo_regions     Region3
exp_concat = InSituExperiment.concat(
    objs={
        "exp_TMA": exp,
        "exp_demo_regions": exp1
    },
    new_col_name="name"
    )
exp_concat
InSituExperiment with 9 samples:
           uid  CITAR slide_id    sample_id    region_key region_name            name
0     d5933ddc  ++-++  0001879  Replicate 1           TMA         A-1         exp_TMA
1     a2e80cc4  ++--+  0001879  Replicate 1           TMA         A-2         exp_TMA
2     48ac6b5f  ++--+  0001879  Replicate 1           TMA         A-3         exp_TMA
3     9c6648b2  ++-++  0001879  Replicate 1           TMA         B-1         exp_TMA
4     4119649d  ++-++  0001879  Replicate 1           TMA         B-2         exp_TMA
5     b56cbd06  ++-++  0001879  Replicate 1           TMA         B-3         exp_TMA
6     0d1f50a5  ++-++  0001879  Replicate 1  demo_regions     Region1  exp_demo_re...
7     16fe63e1  ++-++  0001879  Replicate 1  demo_regions     Region2  exp_demo_re...
8     7900691c  ++-++  0001879  Replicate 1  demo_regions     Region3  exp_demo_re...
exp_concat = InSituExperiment.concat(
    objs=[exp, exp1])
exp_concat
InSituExperiment with 9 samples:
           uid  CITAR slide_id    sample_id    region_key region_name
0     d5933ddc  ++-++  0001879  Replicate 1           TMA         A-1
1     a2e80cc4  ++--+  0001879  Replicate 1           TMA         A-2
2     48ac6b5f  ++--+  0001879  Replicate 1           TMA         A-3
3     9c6648b2  ++-++  0001879  Replicate 1           TMA         B-1
4     4119649d  ++-++  0001879  Replicate 1           TMA         B-2
5     b56cbd06  ++-++  0001879  Replicate 1           TMA         B-3
6     0d1f50a5  ++-++  0001879  Replicate 1  demo_regions     Region1
7     16fe63e1  ++-++  0001879  Replicate 1  demo_regions     Region2
8     7900691c  ++-++  0001879  Replicate 1  demo_regions     Region3
Indexing and selection of data within InSituExperiment#
The InSituExperiment class allows simple selection and filtering of data using indices or True/False masks.
Example 1: Select datasets by index#
exp_indexed = exp_concat[:3]
exp_indexed
InSituExperiment with 3 samples:
           uid  CITAR slide_id    sample_id region_key region_name
0     d5933ddc  ++-++  0001879  Replicate 1        TMA         A-1
1     a2e80cc4  ++--+  0001879  Replicate 1        TMA         A-2
2     48ac6b5f  ++--+  0001879  Replicate 1        TMA         A-3
exp_indexed.show(2)
Also a list of indices can be used for this.
exp_concat[[0,1,4]]
InSituExperiment with 3 samples:
           uid  CITAR slide_id    sample_id region_key region_name
0     d5933ddc  ++-++  0001879  Replicate 1        TMA         A-1
1     a2e80cc4  ++--+  0001879  Replicate 1        TMA         A-2
2     4119649d  ++-++  0001879  Replicate 1        TMA         B-2
Example 2: Select only datasets with a “1” in the region name using a mask#
filtering_mask = exp_concat.metadata["region_name"].str.contains("1", na=False) # NaN values are filled with False
exp_filtered = exp_concat[filtering_mask]
Example 3: Query data#
The .query() function can be used to the pandas.DataFrame.query function.
exp_concat.query(
    criteria="region_key == 'demo_regions'"
)
InSituExperiment with 3 samples:
           uid  CITAR slide_id    sample_id    region_key region_name
0     0d1f50a5  ++-++  0001879  Replicate 1  demo_regions     Region1
1     16fe63e1  ++-++  0001879  Replicate 1  demo_regions     Region2
2     7900691c  ++-++  0001879  Replicate 1  demo_regions     Region3
Save InSituExperiment#
exp_concat.saveas(CACHE / "out/test_insituexperiment", overwrite=True)
Reload InSituExperiment#
exp_reloaded = InSituExperiment.read(CACHE / "out/test_insituexperiment/")
exp_reloaded.load_all()
exp_reloaded
InSituExperiment with 9 samples:
           uid  CITAR  slide_id    sample_id    region_key region_name
0     d5933ddc  ++-++      1879  Replicate 1           TMA         A-1
1     a2e80cc4  ++--+      1879  Replicate 1           TMA         A-2
2     48ac6b5f  ++--+      1879  Replicate 1           TMA         A-3
3     9c6648b2  ++-++      1879  Replicate 1           TMA         B-1
4     4119649d  ++-++      1879  Replicate 1           TMA         B-2
5     b56cbd06  ++-++      1879  Replicate 1           TMA         B-3
6     0d1f50a5  ++-++      1879  Replicate 1  demo_regions     Region1
7     16fe63e1  ++-++      1879  Replicate 1  demo_regions     Region2
8     7900691c  ++-++      1879  Replicate 1  demo_regions     Region3
exp_reloaded.show(2)
exp_reloaded.save()
exp_reloaded = InSituExperiment.read(CACHE / "out/test_insituexperiment/")
exp_reloaded.load_all()
exp_reloaded.data[2]
InSituData
Method:		Xenium
Slide ID:	0001879
Sample ID:	Replicate 1
Path:		C:\Users\ge37voy\.cache\InSituPy\out\test_insituexperiment\data-002

    ➤ images
       CD20:	(4706, 4705)
       HE:	(4706, 4705, 3)
       HER2:	(4706, 4705)
       nuclei:	(4706, 4705)
    ➤ cells
       MultiCellData with main layer 'main'
           matrix
               AnnData object with n_obs × n_vars = 1807 × 297
               obs: 'transcript_counts', 'control_probe_counts', 'control_codeword_counts', 'total_counts', 'cell_area', 'nucleus_area', 'n_genes_by_counts', 'n_genes', 'leiden', 'cell_type_dc', 'cell_type_dc_sub', 'cell_type_tacco', 'cell_type_publ'
               var: 'gene_ids', 'feature_types', 'genome', 'n_cells_by_counts', 'mean_counts', 'pct_dropout_by_counts', 'total_counts', 'n_cells'
               uns: 'cell_type_dc_colors', 'cell_type_dc_sub', 'cell_type_dc_sub_colors', 'cell_type_publ_colors', 'cell_type_tacco_colors', 'counts_location', 'leiden', 'leiden_colors', 'log1p', 'neighbors', 'pca', 'umap'
               obsm: 'OT', 'X_pca', 'X_umap', 'annotations', 'ora_estimate', 'ora_pvals', 'regions', 'spatial'
               varm: 'OT', 'PCs'
               layers: 'counts', 'norm_counts'
               obsp: 'connectivities', 'distances'
           boundaries
               BoundariesData object with 2 entries:
                   cells
                   nuclei
    ➤ regions
       TMA:	1 regions, 1 class ('A-3')
exp_reloaded.show(2)
INFO: Added 3 new annotations to key 'TestKey'
Annotations or regions can now be added to the individual datasets and by pressing the “Sync Geometries” button they are saved in the corresponding InSituData object:
exp_reloaded.data[2]
InSituData
Method:		Xenium
Slide ID:	0001879
Sample ID:	Replicate 1
Path:		C:\Users\ge37voy\.cache\InSituPy\out\test_insituexperiment\data-002

    ➤ images
       CD20:	(4706, 4705)
       HE:	(4706, 4705, 3)
       HER2:	(4706, 4705)
       nuclei:	(4706, 4705)
    ➤ cells
       MultiCellData with main layer 'main'
           matrix
               AnnData object with n_obs × n_vars = 1807 × 297
               obs: 'transcript_counts', 'control_probe_counts', 'control_codeword_counts', 'total_counts', 'cell_area', 'nucleus_area', 'n_genes_by_counts', 'n_genes', 'leiden', 'cell_type_dc', 'cell_type_dc_sub', 'cell_type_tacco', 'cell_type_publ'
               var: 'gene_ids', 'feature_types', 'genome', 'n_cells_by_counts', 'mean_counts', 'pct_dropout_by_counts', 'total_counts', 'n_cells'
               uns: 'cell_type_dc_colors', 'cell_type_dc_sub', 'cell_type_dc_sub_colors', 'cell_type_publ_colors', 'cell_type_tacco_colors', 'counts_location', 'leiden', 'leiden_colors', 'log1p', 'neighbors', 'pca', 'umap'
               obsm: 'OT', 'X_pca', 'X_umap', 'annotations', 'ora_estimate', 'ora_pvals', 'regions', 'spatial'
               varm: 'OT', 'PCs'
               layers: 'counts', 'norm_counts'
               obsp: 'connectivities', 'distances'
           boundaries
               BoundariesData object with 2 entries:
                   cells
                   nuclei
    ➤ annotations
       TestKey:	3 annotations, 1 class ('test')
    ➤ regions
       TMA:	1 regions, 1 class ('A-3')