Demonstrate reading of data from Vannan et al.#
Paper: Vannan et al. All data from the paper is accessible here.
For the demo we use the data of “TMA5”:
## The following code ensures that all functions and init files are reloaded before executions.
%load_ext autoreload
%autoreload 2
from insitupy.io import read_xenium
from pathlib import Path
After extraction of the data from the tar.gz file, data is located in GSE250346_IPFTMA5/IPFTMA5.
data_path = Path(r"E:\vannan\GSE250346_IPFTMA5\IPFTMA5")
xd = read_xenium(data_path)
Loading cells...
Loading images...
Loading transcripts...
xd
InSituData
Method:		Xenium
Slide ID:	0024909
Sample ID:	CustomPanel
Path:		E:\vannan\GSE250346_IPFTMA5\IPFTMA5

    ➤ images
       'nuclei':   (91812, 54047)
    ➤ cells
       MultiCellData with main layer 'main'
           table
               AnnData object with n_obs × n_vars = 628860 × 343
               obs: 'transcript_counts', 'control_probe_counts', 'control_codeword_counts', 'unassigned_codeword_counts', 'deprecated_codeword_counts', 'total_counts', 'cell_area', 'nucleus_area'
               var: 'gene_ids', 'feature_types', 'genome'
               obsm: 'spatial'
           boundaries
               BoundariesData object with 2 entries:
                   cells
                   nuclei
    ➤ transcripts
       DataFrame with shape <dask_expr.expr.Scalar: expr=ReadParquetFSSpec(9515f70).size() // 11, dtype=int64> x 11
xd.import_regions(data_path.parent.parent / "IPFTMA5_regions/TMA.geojson", keys="TMA", scale_factor=1)
xd
InSituData
Method:		Xenium
Slide ID:	0024909
Sample ID:	CustomPanel
Path:		E:\vannan\GSE250346_IPFTMA5\IPFTMA5

    ➤ images
       'nuclei':   (91812, 54047)
    ➤ cells
       MultiCellData with main layer 'main'
           table
               AnnData object with n_obs × n_vars = 628860 × 343
               obs: 'transcript_counts', 'control_probe_counts', 'control_codeword_counts', 'unassigned_codeword_counts', 'deprecated_codeword_counts', 'total_counts', 'cell_area', 'nucleus_area'
               var: 'gene_ids', 'feature_types', 'genome'
               obsm: 'spatial'
           boundaries
               BoundariesData object with 2 entries:
                   cells
                   nuclei
    ➤ regions
       TMA:	6 regions, 6 classes ('A1', 'A2', 'A3', 'B1', 'B2', 'B3')
    ➤ transcripts
       DataFrame with shape <dask_expr.expr.Scalar: expr=ReadParquetFSSpec(9515f70).size() // 11, dtype=int64> x 11
Visualize whole dataset and add TMA regions#
Since all TMA cores are within one dataset, one has to now annotate the individual TMA cores as regions. For this, go to the “Add geometries” widget on the right hand side of the napari viewer, select “Type=Regions”, add a value for “Key” (e.g. “TMA”) and a value for “Class” (e.g. “A1”). Add the regions layer by clicking “Add”. Then annotate the region of the first TMA core using the drawing tools provided on the top left. Repeat this procedure for all TMA cores. Importantly, for each TMA core a new shapes layer has to be added by providing a new “Class” (e.g. “A2”, “A3”, “B1”, etc.). Subsequently, the geometries can be synced to the InSituData object by clicking “Sync geometries” on the bottom right of the viewer.
xd.show()
INFO: New layer '🌍 A1 (TMA)' created.
INFO: New layer '🌍 A2 (TMA)' created.
INFO: New layer '🌍 A3 (TMA)' created.
INFO: New layer '🌍 B1 (TMA)' created.
INFO: New layer '🌍 B2 (TMA)' created.
INFO: New layer '🌍 B3 (TMA)' created.
---------------------------------------------------------------------------
TypeError                                 Traceback (most recent call last)
File c:\Users\ge37voy\AppData\Local\miniconda3\envs\insitupy\lib\site-packages\napari\_qt\threads\status_checker.py:126, in StatusChecker.calculate_status(self=<napari._qt.threads.status_checker.StatusChecker object>)
    122     return
    124 try:
    125     # Calculate the status change from cursor's movement
--> 126     res = viewer._calc_status_from_cursor()
        viewer = Viewer(camera=Camera(center=(0.0, np.float64(6030.082385789948), np.float64(7345.125508794302)), zoom=np.float64(0.17993749575687482), angles=(0.0, 0.0, 90.0), perspective=0.0, mouse_pan=False, mouse_zoom=True, orientation=(<DepthAxisOrientation.TOWARDS: 'towards'>, <VerticalAxisOrientation.DOWN: 'down'>, <HorizontalAxisOrientation.RIGHT: 'right'>)), cursor=Cursor(position=(np.float64(5429.873819014375), np.float64(4424.667050642873)), scaled=True, style=<CursorStyle.POINTING: 'pointing'>, size=1.0), dims=Dims(ndim=2, ndisplay=2, order=(0, 1), axis_labels=('0', '1'), rollable=(True, True), range=(RangeTuple(start=np.float64(0.0), stop=np.float64(19509.837499999998), step=np.float64(0.2125)), RangeTuple(start=np.float64(0.0), stop=np.float64(11562.5517578125), step=np.float64(0.2125))), margin_left=(0.0, 0.0), margin_right=(0.0, 0.0), point=(np.float64(9754.8125), np.float64(5742.3875)), last_used=0), grid=GridCanvas(stride=1, shape=(-1, -1), enabled=False, spacing=0.0), layers=[<Image layer 'nuclei' at 0x1a982857640>, <Shapes layer '🌍 A1 (TMA)' at 0x1a9826db2b0>, <Shapes layer '🌍 A2 (TMA)' at 0x1a9826db370>, <Shapes layer '🌍 A3 (TMA)' at 0x1a9828807f0>, <Shapes layer '🌍 B1 (TMA)' at 0x1a9826dada0>, <Shapes layer '🌍 B2 (TMA)' at 0x1a982869c30>, <Shapes layer '🌍 B3 (TMA)' at 0x1a98286c3a0>], help='use <6> for move camera, use <7> for transform, use <R> for add rectangles, use <E> for add ellipses, use <L> for add lines, use <Shift+L> for add polylines, use <T> for add path, use <P> for add polygons, use <Shift+P> for add polygons lasso, use <4> for select vertices, use <2> for insert vertex, use <1> for remove vertex', status='', tooltip=Tooltip(visible=False, text=''), theme='dark', title='#276ecbc1', mouse_over_canvas=False, mouse_move_callbacks=[], mouse_drag_callbacks=[], mouse_double_click_callbacks=[<function double_click_to_zoom at 0x000001A9D8D695A0>], mouse_wheel_callbacks=[<function dims_scroll at 0x000001A9D8D69F30>], _persisted_mouse_event={}, _mouse_drag_gen={}, _mouse_wheel_gen={}, _keymap={})
    127 except Exception as e:  # pragma: no cover # noqa: BLE001
    128     # Our codebase is not threadsafe. It is possible that an
    129     # ViewerModel or Layer state is changed while we are trying to
   (...)
    132     # from crashing the thread. The exception is logged
    133     # and a notification is sent.
    134     notification_manager.dispatch(Notification.from_exception(e))

File c:\Users\ge37voy\AppData\Local\miniconda3\envs\insitupy\lib\site-packages\napari\components\viewer_model.py:722, in ViewerModel._calc_status_from_cursor(self=Viewer(camera=Camera(center=(0.0, np.float64(603...use_drag_gen={}, _mouse_wheel_gen={}, _keymap={}))
    719 # If there is an active layer and a single selection, calculate status using "the classic way".
    720 # Then return the status and the tooltip.
    721 if active is not None and active._loaded and len(selection) < 2:
--> 722     status = active.get_status(
        active = <Shapes layer '🌍 B3 (TMA)' at 0x1a98286c3a0>
        self = Viewer(camera=Camera(center=(0.0, np.float64(6030.082385789948), np.float64(7345.125508794302)), zoom=np.float64(0.17993749575687482), angles=(0.0, 0.0, 90.0), perspective=0.0, mouse_pan=False, mouse_zoom=True, orientation=(<DepthAxisOrientation.TOWARDS: 'towards'>, <VerticalAxisOrientation.DOWN: 'down'>, <HorizontalAxisOrientation.RIGHT: 'right'>)), cursor=Cursor(position=(np.float64(5429.873819014375), np.float64(4424.667050642873)), scaled=True, style=<CursorStyle.POINTING: 'pointing'>, size=1.0), dims=Dims(ndim=2, ndisplay=2, order=(0, 1), axis_labels=('0', '1'), rollable=(True, True), range=(RangeTuple(start=np.float64(0.0), stop=np.float64(19509.837499999998), step=np.float64(0.2125)), RangeTuple(start=np.float64(0.0), stop=np.float64(11562.5517578125), step=np.float64(0.2125))), margin_left=(0.0, 0.0), margin_right=(0.0, 0.0), point=(np.float64(9754.8125), np.float64(5742.3875)), last_used=0), grid=GridCanvas(stride=1, shape=(-1, -1), enabled=False, spacing=0.0), layers=[<Image layer 'nuclei' at 0x1a982857640>, <Shapes layer '🌍 A1 (TMA)' at 0x1a9826db2b0>, <Shapes layer '🌍 A2 (TMA)' at 0x1a9826db370>, <Shapes layer '🌍 A3 (TMA)' at 0x1a9828807f0>, <Shapes layer '🌍 B1 (TMA)' at 0x1a9826dada0>, <Shapes layer '🌍 B2 (TMA)' at 0x1a982869c30>, <Shapes layer '🌍 B3 (TMA)' at 0x1a98286c3a0>], help='use <6> for move camera, use <7> for transform, use <R> for add rectangles, use <E> for add ellipses, use <L> for add lines, use <Shift+L> for add polylines, use <T> for add path, use <P> for add polygons, use <Shift+P> for add polygons lasso, use <4> for select vertices, use <2> for insert vertex, use <1> for remove vertex', status='', tooltip=Tooltip(visible=False, text=''), theme='dark', title='#276ecbc1', mouse_over_canvas=False, mouse_move_callbacks=[], mouse_drag_callbacks=[], mouse_double_click_callbacks=[<function double_click_to_zoom at 0x000001A9D8D695A0>], mouse_wheel_callbacks=[<function dims_scroll at 0x000001A9D8D69F30>], _persisted_mouse_event={}, _mouse_drag_gen={}, _mouse_wheel_gen={}, _keymap={})
        self.cursor.position = (np.float64(5429.873819014375), np.float64(4424.667050642873))
        self.cursor = Cursor(position=(np.float64(5429.873819014375), np.float64(4424.667050642873)), scaled=True, style=<CursorStyle.POINTING: 'pointing'>, size=1.0)
        self.cursor._view_direction = None
        self.dims = Dims(ndim=2, ndisplay=2, order=(0, 1), axis_labels=('0', '1'), rollable=(True, True), range=(RangeTuple(start=np.float64(0.0), stop=np.float64(19509.837499999998), step=np.float64(0.2125)), RangeTuple(start=np.float64(0.0), stop=np.float64(11562.5517578125), step=np.float64(0.2125))), margin_left=(0.0, 0.0), margin_right=(0.0, 0.0), point=(np.float64(9754.8125), np.float64(5742.3875)), last_used=0)
    723         self.cursor.position,
    724         view_direction=self.cursor._view_direction,
    725         dims_displayed=list(self.dims.displayed),
    726         world=True,
    727     )
    728     return status, tooltip_text
    730 # Otherwise, return the layer status of multiple selected layers
    731 # or gridded layers as well as the tooltip.

File c:\Users\ge37voy\AppData\Local\miniconda3\envs\insitupy\lib\site-packages\napari\layers\base\base.py:2167, in Layer.get_status(self=<Shapes layer '🌍 B3 (TMA)'>, position=array([7352.76375, 8376.03913]), view_direction=None, dims_displayed=[0, 1], world=True, value=None)
   2165 if position is not None:
   2166     position = np.asarray(position)
-> 2167     value = self.get_value(
        value = None
        self = <Shapes layer '🌍 B3 (TMA)' at 0x1a98286c3a0>
        position = array([7352.76375, 8376.03913])
        view_direction = None
        dims_displayed = [0, 1]
        world = True
   2168         position,
   2169         view_direction=view_direction,
   2170         dims_displayed=dims_displayed,
   2171         world=world,
   2172     )
   2173     coords_str, value_str = generate_layer_status_strings(
   2174         position[-self.ndim :],
   2175         value,
   2176     )
   2177 else:

File c:\Users\ge37voy\AppData\Local\miniconda3\envs\insitupy\lib\site-packages\napari\layers\base\base.py:1390, in Layer.get_value(self=<Shapes layer '🌍 B3 (TMA)'>, position=array([7352.76375, 8376.03913]), view_direction=None, dims_displayed=[np.int64(0), np.int64(1)], world=True)
   1384             value = self._get_value_3d(
   1385                 start_point=start_point,
   1386                 end_point=end_point,
   1387                 dims_displayed=dims_displayed,
   1388             )
   1389     else:
-> 1390         value = self._get_value(position)
        position = array([7352.76375, 8376.03913])
        self = <Shapes layer '🌍 B3 (TMA)' at 0x1a98286c3a0>
   1392 else:
   1393     value = None

File c:\Users\ge37voy\AppData\Local\miniconda3\envs\insitupy\lib\site-packages\napari\layers\shapes\shapes.py:2882, in Shapes._get_value(self=<Shapes layer '🌍 B3 (TMA)'>, position=array([7352.76375, 8376.03913]))
   2875 # Get the vertex sizes. They need to be rescaled by a few parameters:
   2876 # - scale_factor, because vertex sizes are zoom-invariant
   2877 # - scale, because vertex sizes are not affected by scale (unlike in Points)
   2878 # - 2, because the radius is what we need
   2880 if self._mode == Mode.SELECT:
   2881     # Check if inside vertex of interaction box or rotation handle
-> 2882     box = self._selected_box[Box.WITH_HANDLE]
        self = <Shapes layer '🌍 B3 (TMA)' at 0x1a98286c3a0>
        self._selected_box = array([[4103.98389, 8235.65234],
       [5871.09375, 8235.65234],
       ...,
       [5871.09375, 9878.10156],
       [3992.83418, 9878.10156]], shape=(10, 2))
        Box.WITH_HANDLE = [0, 1, 2, 3, 4, 5, 6, 7, 9]
   2883     distances = abs(box - coord)
   2885     # Check if any matching vertices

TypeError: 'NoneType' object is not subscriptable
INFO: New layer '🌍 B3 (TMA)' created.
WARNING: Data contains already regions with key 'TMA' and class 'B3'. To show them use the 'Show geometries' widget.

xd
InSituData
Method:		Xenium
Slide ID:	0024909
Sample ID:	CustomPanel
Path:		E:\vannan\GSE250346_IPFTMA5\IPFTMA5

    ➤ images
       'nuclei':   (91812, 54047)
    ➤ cells
       MultiCellData with main layer 'main'
           table
               AnnData object with n_obs × n_vars = 628860 × 343
               obs: 'transcript_counts', 'control_probe_counts', 'control_codeword_counts', 'unassigned_codeword_counts', 'deprecated_codeword_counts', 'total_counts', 'cell_area', 'nucleus_area'
               var: 'gene_ids', 'feature_types', 'genome'
               obsm: 'spatial'
           boundaries
               BoundariesData object with 2 entries:
                   cells
                   nuclei
    ➤ regions
       TMA:	6 regions, 6 classes ('A1', 'A2', 'A3', 'B1', 'B2', 'B3')
    ➤ transcripts
       DataFrame with shape <dask_expr.expr.Scalar: expr=ReadParquetFSSpec(f3737d8).size() // 11, dtype=int64> x 11
xd.regions["TMA"]
| objectType | origin | layer_type | geometry | name | color | |
|---|---|---|---|---|---|---|
| id | ||||||
| 71e1d78f-c358-4c66-8855-509f7ea6d94b | region | file | Shapes | POLYGON ((1425.59082 2457.01099, 1221.47949 30... | A1 | [255, 170, 0] |
| 63ebcb72-e979-47dd-a700-f5c667c6162e | region | file | Shapes | POLYGON ((5059.10596 1476.88135, 4935.9292 189... | A2 | [255, 170, 0] |
| 7b5012b3-7c4a-4a05-8c3c-21e24b1142b7 | region | file | Shapes | POLYGON ((8773.82812 800.05548, 8568.34375 159... | A3 | [255, 170, 0] |
| d85109c0-d78c-4872-bb35-d7c4a3d62c66 | region | file | Shapes | POLYGON ((1036.69885 3338.63794, 907.56073 478... | B1 | [255, 170, 0] |
| a38e6db1-fd7d-4a5f-a2d1-fb3228953eb0 | region | file | Shapes | POLYGON ((4927.44873 5142.26123, 4849.4292 551... | B2 | [255, 170, 0] |
| d3763572-b2fd-4123-a989-702107e09d4a | region | file | Shapes | POLYGON ((8665.07812 4103.98389, 8458.31738 51... | B3 | [255, 170, 0] |
Saving the transcript data can take very long. To speed up the process for this tutorial, we remove the transcripts in the following step.
del xd.transcripts
from insitupy import InSituExperiment
exp = InSituExperiment.from_regions(xd, region_key="TMA")
exp
InSituExperiment (insitupy mode) with 6 samples:
           uid  CITAR slide_id    sample_id region_key region_name
0     1097134d  ++--+  0024909  CustomPanel        TMA          A1
1     5a16ef86  ++--+  0024909  CustomPanel        TMA          A2
2     169485b8  ++--+  0024909  CustomPanel        TMA          A3
3     a7059e74  ++--+  0024909  CustomPanel        TMA          B1
4     8e9d8c12  ++--+  0024909  CustomPanel        TMA          B2
5     e1d7f9bc  ++--+  0024909  CustomPanel        TMA          B3
data_out = data_path.parent.parent / "IPFTMA5_insitupy"
exp.saveas(data_out)
exp = InSituExperiment.read(data_out)
exp.load_all()
exp
InSituExperiment (insitupy mode) with 6 samples:
           uid  CITAR  slide_id    sample_id region_key region_name
0     1097134d  ++--+     24909  CustomPanel        TMA          A1
1     5a16ef86  ++--+     24909  CustomPanel        TMA          A2
2     169485b8  ++--+     24909  CustomPanel        TMA          A3
3     a7059e74  ++--+     24909  CustomPanel        TMA          B1
4     8e9d8c12  ++--+     24909  CustomPanel        TMA          B2
5     e1d7f9bc  ++--+     24909  CustomPanel        TMA          B3
Add metadata#
Unfortunately, we were not able to find the TMA layout with metadata information for TMA5 from the publication. Therefore, we demonstrate addition of the metadata with mock metadata.
Option 1: Column by column#
exp.add_metadata_column(
    column_name="status",
    values=["Control", "Disease", "Disease", "Control", "Control", "Disease"]
)
Option 2: Using metadata CSV file#
In such a case it is important to specify the by argument to correctly pair incoming and existing metadata.
exp.append_metadata(
    new_metadata=r"C:\Users\ge37voy\Github\InSituPy\docs\source\demo_data\demo_experiment\vannan_metadata_mock.csv",
    by="region_name"
)
exp
InSituExperiment (insitupy mode) with 6 samples:
           uid  CITAR  slide_id    sample_id region_key region_name   status clinical_diagnosis       ethnicity tobacco
0     1097134d  ++--+     24909  CustomPanel        TMA          A1  Control         control           european       y
1     5a16ef86  ++--+     24909  CustomPanel        TMA          A2  Disease             IPF           european       y
2     169485b8  ++--+     24909  CustomPanel        TMA          A3  Disease             ILD           european       n
3     a7059e74  ++--+     24909  CustomPanel        TMA          B1  Control             IPF     african ame...       n
4     8e9d8c12  ++--+     24909  CustomPanel        TMA          B2  Control         control           hispanic       y
5     e1d7f9bc  ++--+     24909  CustomPanel        TMA          B3  Disease            NSIP           european       y
Visualization#
from insitupy.plotting import spatial, overview
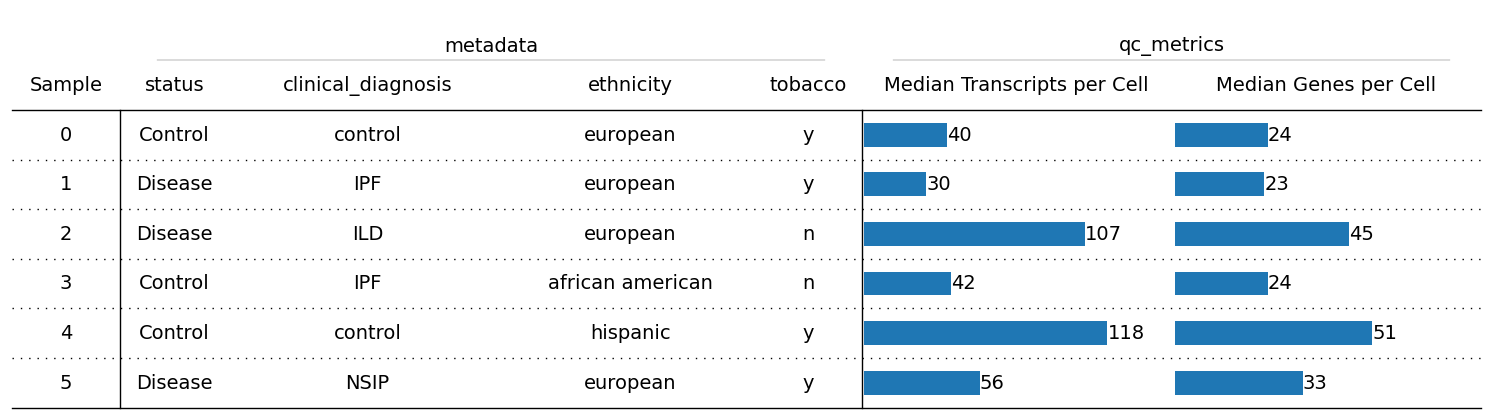
Metadata overview#
overview(exp, columns_to_plot=["status", "clinical_diagnosis", "ethnicity", "tobacco"])
Visualize individual datasets in napari viewer#
exp.show(0)
Preprocessing#
For more information on data preprocessing see this tutorial.
For iterating through all datasets of an InSituExperiment object, one can use .iterdata(). For more information on the general funcationalities of the InSituExperiment see this notebook.
from insitupy.preprocessing import calculate_qc_metrics
from insitupy.plotting import plot_qc_metrics
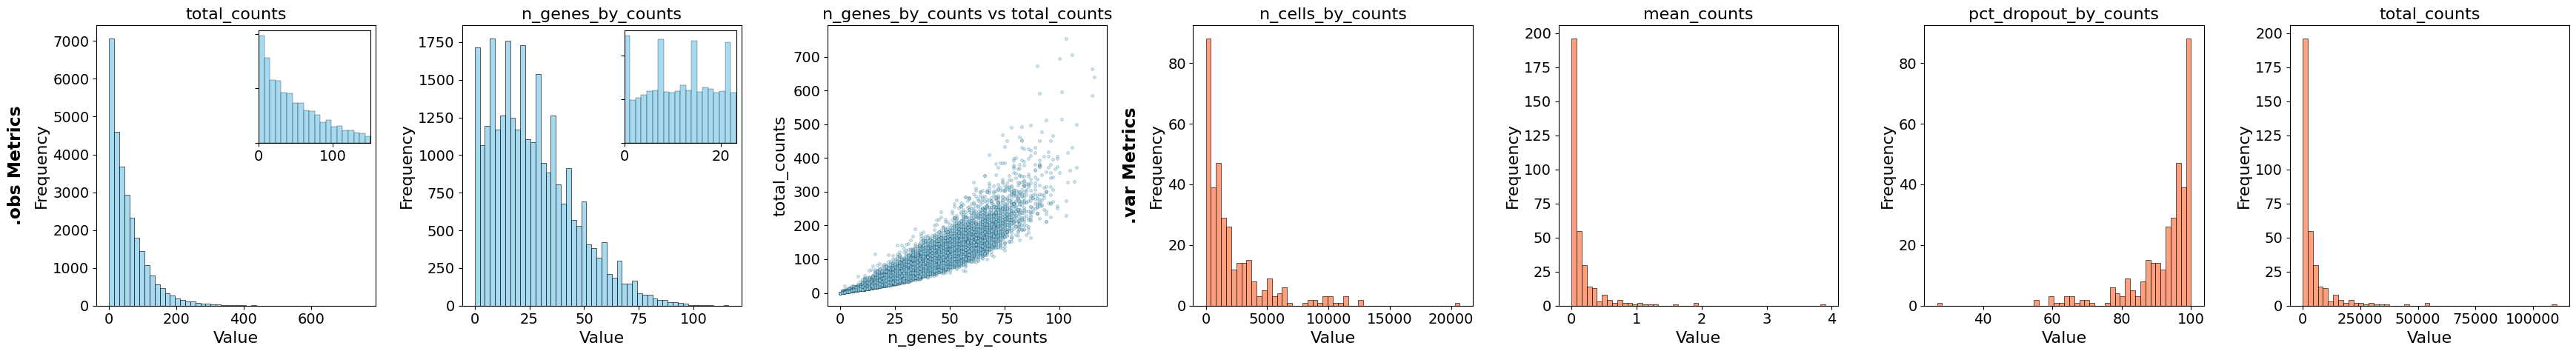
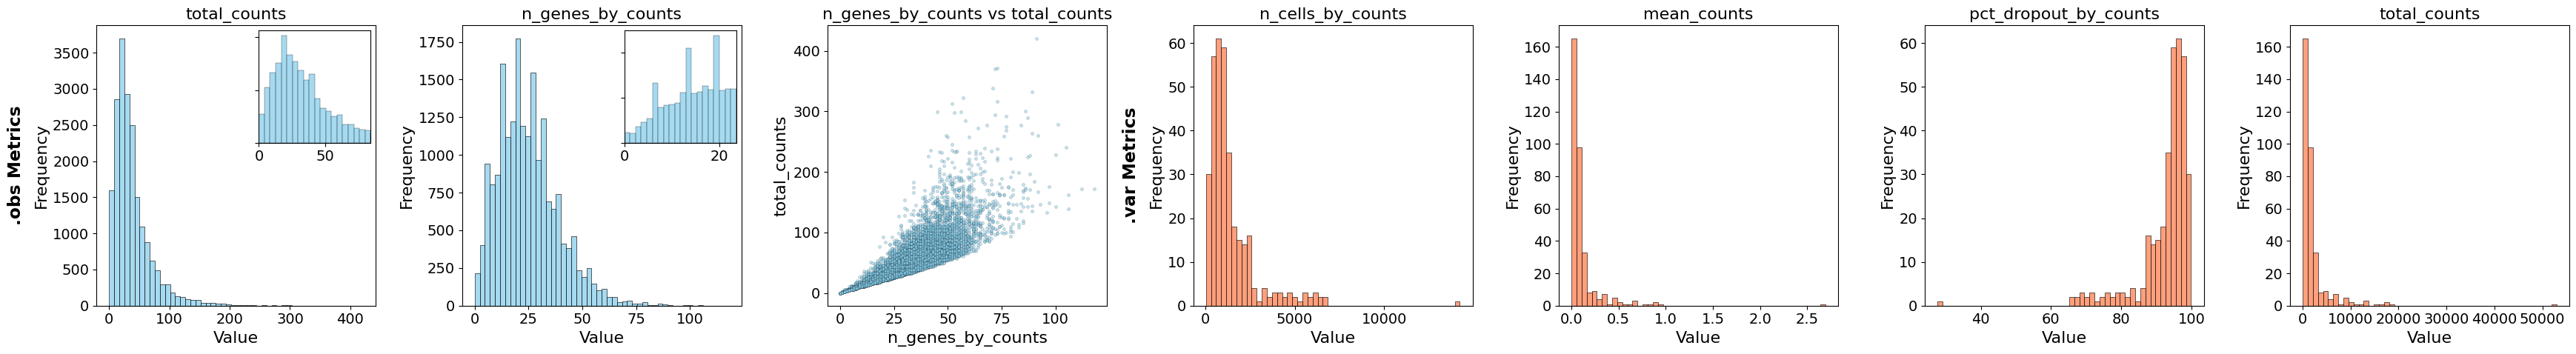
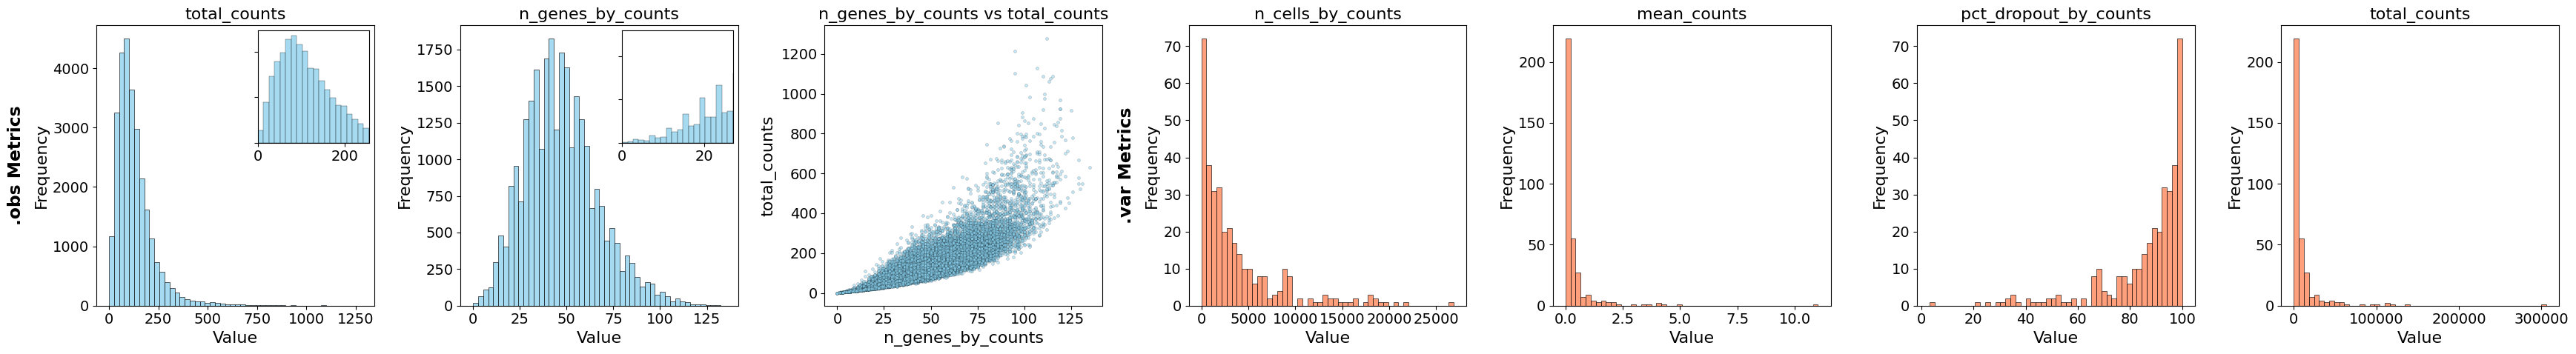
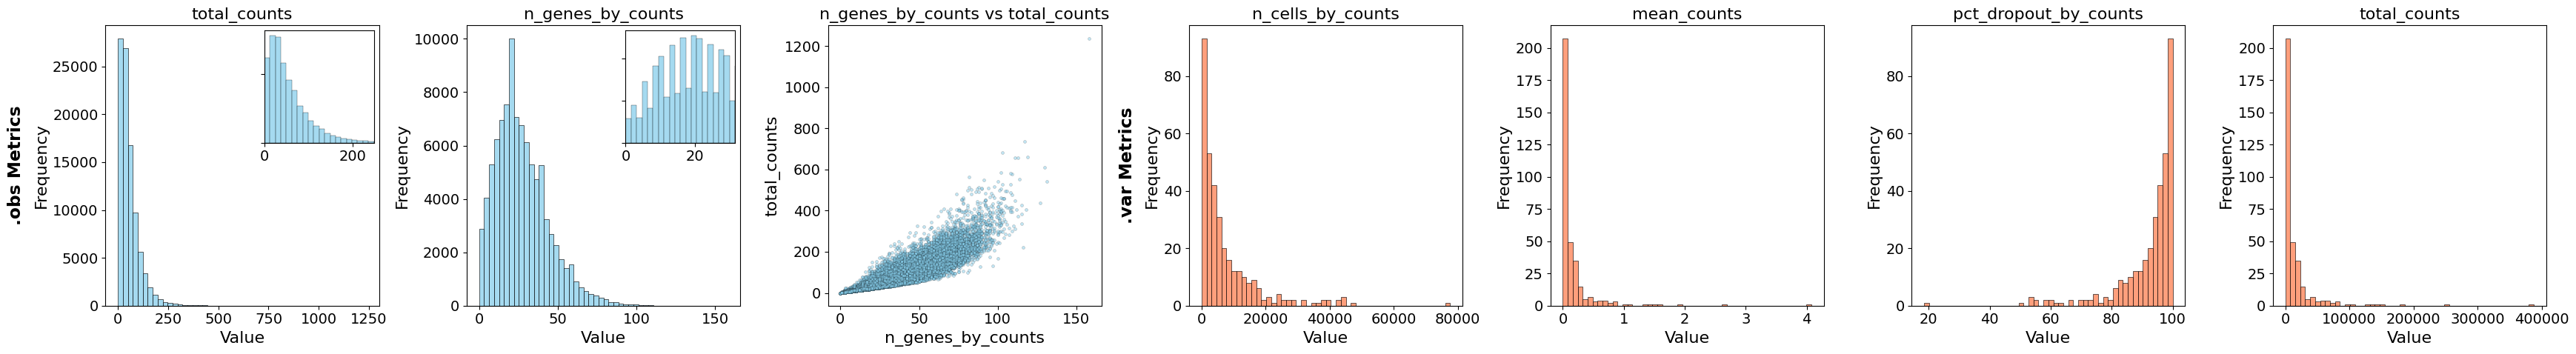
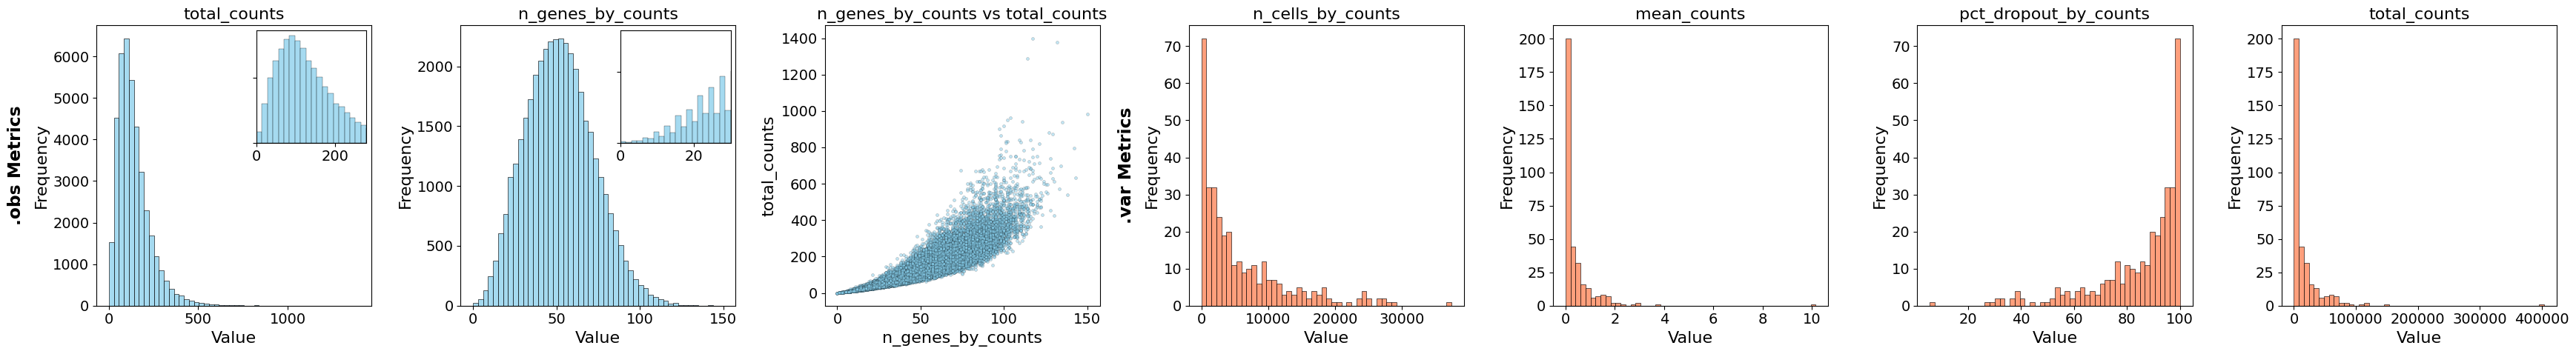
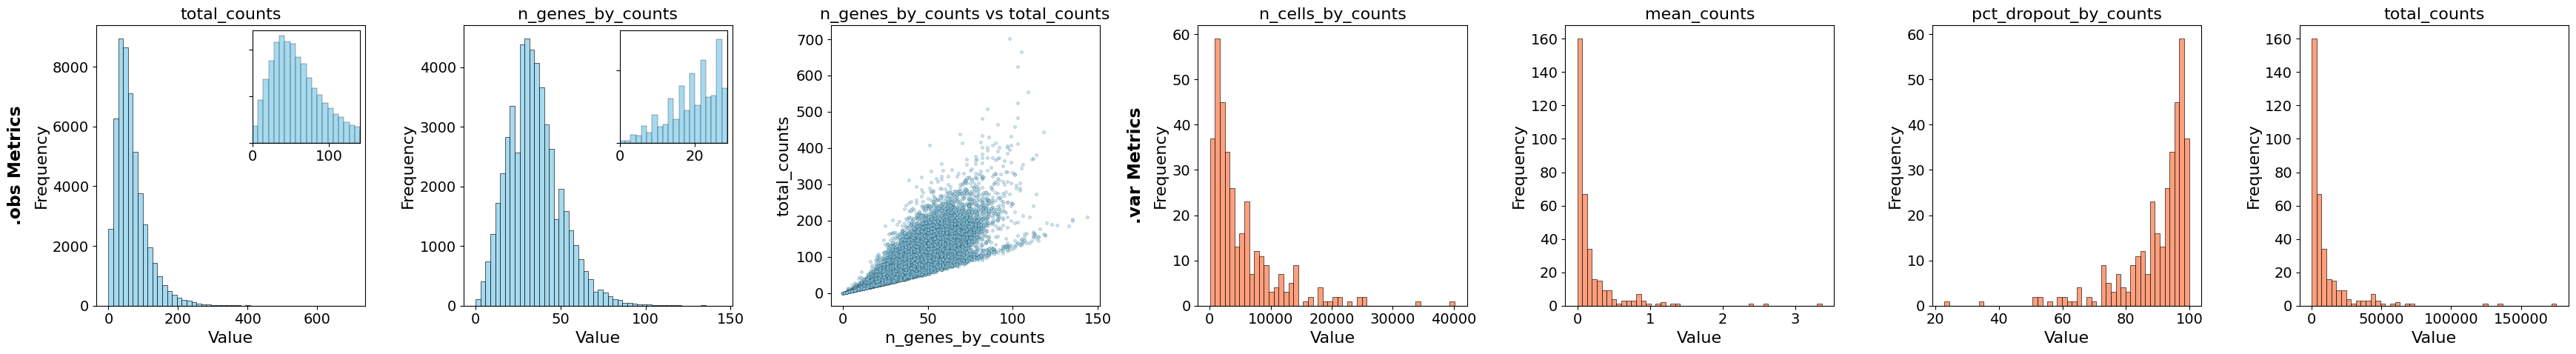
Calculate QC metrics#
for meta, data in exp.iterdata():
    calculate_qc_metrics(data, percent_top=None, log1p=False)
for meta, data in exp.iterdata():
    print(meta["region_name"])
    plot_qc_metrics(data, show_inset=True)
A1
A2
A3
B1
B2
B3
Normalization and transformation#
from insitupy.preprocessing import normalize_and_transform
for meta, data in exp.iterdata():
    normalize_and_transform(
        data,
        transformation_method="log1p",
        target_sum=250,
        scale=False,
        verbose=False
        )
Dimensionality reduction#
from insitupy.preprocessing import reduce_dimensions, cluster_cells
for meta, data in exp.iterdata():
    print(meta["region_name"])
    reduce_dimensions(
        data,
        n_neighbors=15,
        n_pcs=None
        )
A1
Calculate PCA...
Calculate neighbors...
Calculate umap...
A2
Calculate PCA...
Calculate neighbors...
Calculate umap...
A3
Calculate PCA...
Calculate neighbors...
Calculate umap...
B1
Calculate PCA...
Calculate neighbors...
Calculate umap...
B2
Calculate PCA...
Calculate neighbors...
Calculate umap...
B3
Calculate PCA...
Calculate neighbors...
Calculate umap...
Cluster cells#
for meta, data in exp.iterdata():
    print(meta["region_name"])
    cluster_cells(
        data,
        method="leiden"
        )
A1
A2
A3
B1
B2
B3
Save results#
exp.save()
exp
InSituExperiment (insitupy mode) with 6 samples:
           uid  CITAR  slide_id    sample_id region_key region_name   status clinical_diagnosis       ethnicity tobacco
0     1097134d  ++--+     24909  CustomPanel        TMA          A1  Control         control           european       y
1     5a16ef86  ++--+     24909  CustomPanel        TMA          A2  Disease             IPF           european       y
2     169485b8  ++--+     24909  CustomPanel        TMA          A3  Disease             ILD           european       n
3     a7059e74  ++--+     24909  CustomPanel        TMA          B1  Control             IPF     african ame...       n
4     8e9d8c12  ++--+     24909  CustomPanel        TMA          B2  Control         control           hispanic       y
5     e1d7f9bc  ++--+     24909  CustomPanel        TMA          B3  Disease            NSIP           european       y
Reload data
exp = InSituExperiment.read(data_out)
exp.load_all()
Inspect results#
Interactive visualization#
exp.show(2)
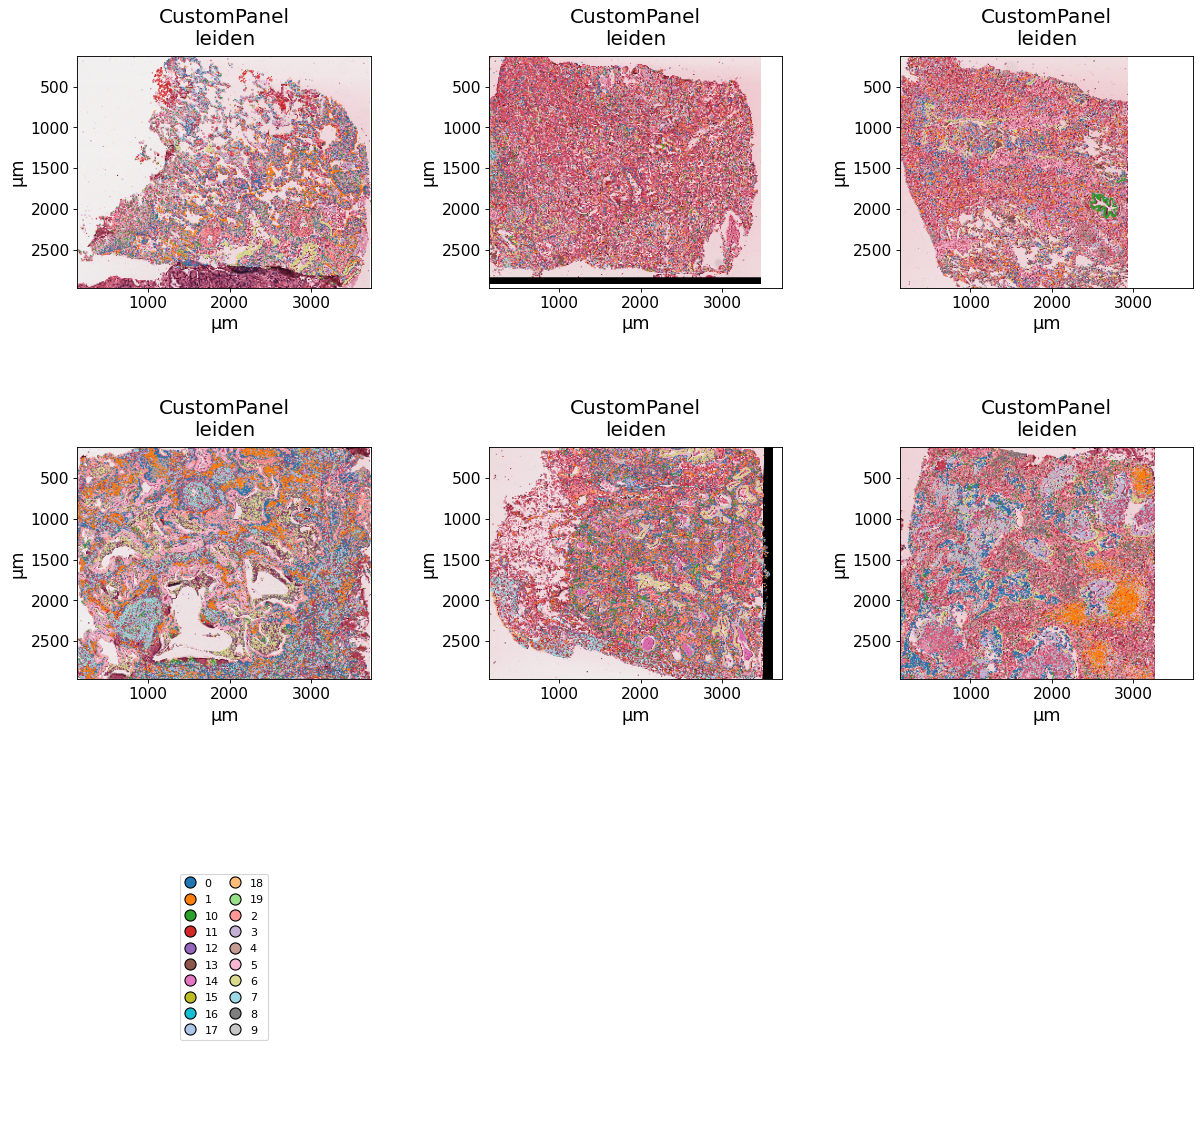
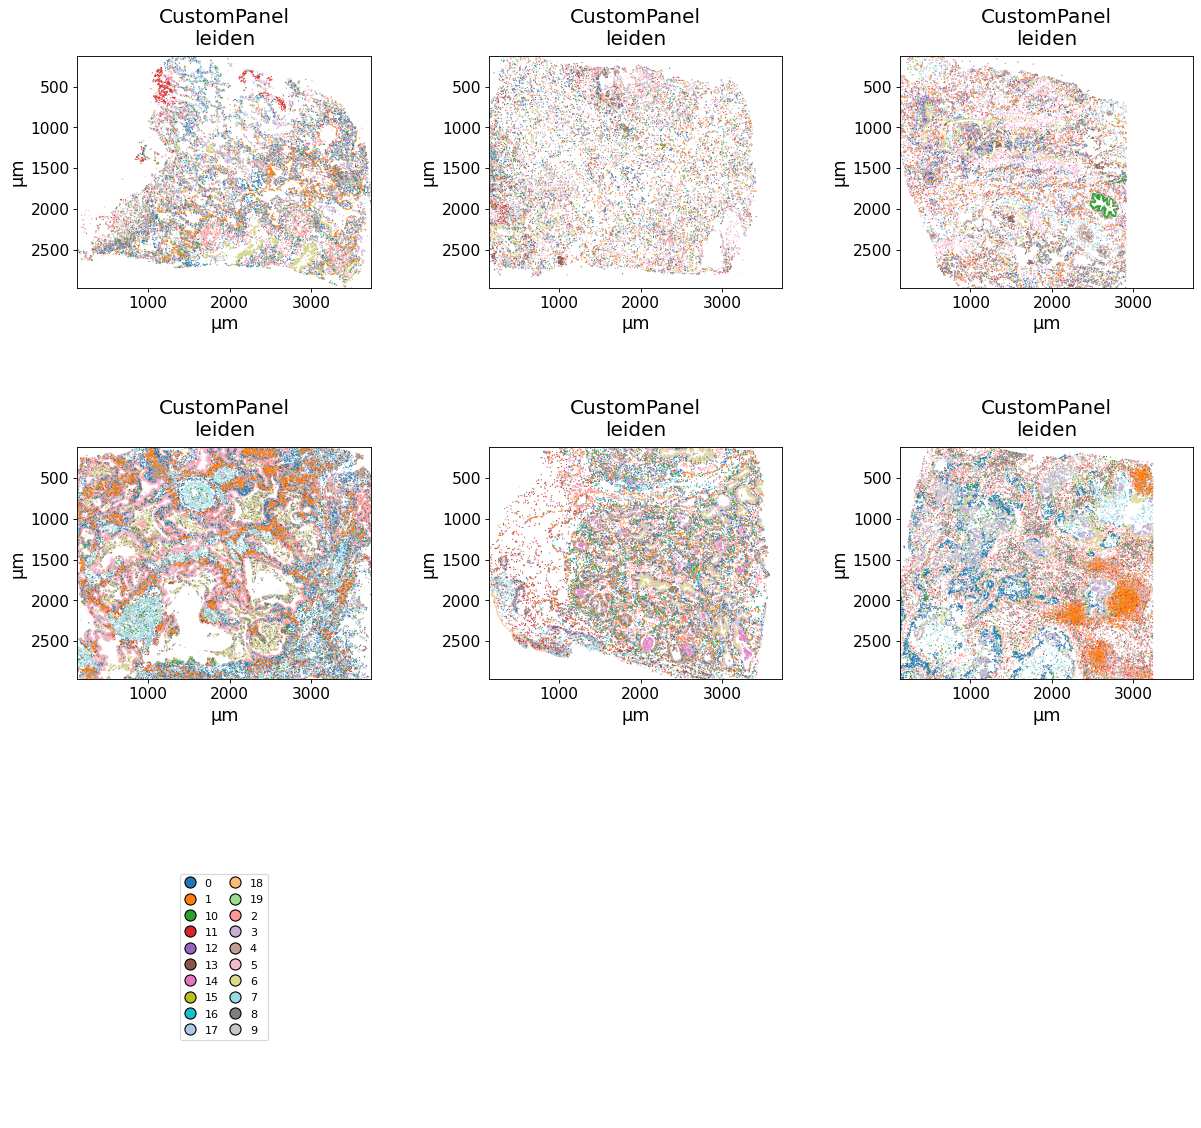
E.g. we can plot the clusters:
Static plotting#
spatial(data=exp, keys="leiden", max_cols=3, savepath="figures/spatial_leiden.pdf")
Synchronized colors for key 'leiden' and palette 'tab20_mod'.
Register HE images#
To extract the individual HE images from the whole slide image, follow either this tutorial to do it within InSituPy or use QuPath and export the individual images using this script.
The image paths we can then add to the InSituExperiment metadata as follows:
exp.add_metadata_column(
    column_name="HE_path",
    values=[
        r"E:\vannan\IPFTMA5_HE\image_export\A1.ome.tif",
        r"E:\vannan\IPFTMA5_HE\image_export\A2.ome.tif",
        r"E:\vannan\IPFTMA5_HE\image_export\A3.ome.tif",
        r"E:\vannan\IPFTMA5_HE\image_export\B1.ome.tif",
        r"E:\vannan\IPFTMA5_HE\image_export\B2.ome.tif",
        r"E:\vannan\IPFTMA5_HE\image_export\B3.ome.tif"
        ]
    )
exp.metadata
You are accessing a copy of the metadata. Changes to this DataFrame will not affect the internal metadata. Use `add_metadata_column()` or `append_metadata()` to add new information to the metadata.
| uid | slide_id | sample_id | region_key | region_name | status | clinical_diagnosis | ethnicity | tobacco | HE_path | |
|---|---|---|---|---|---|---|---|---|---|---|
| 0 | 1097134d | 24909 | CustomPanel | TMA | A1 | Control | control | european | y | E:\vannan\IPFTMA5_HE\image_export\A1.ome.tif |
| 1 | 5a16ef86 | 24909 | CustomPanel | TMA | A2 | Disease | IPF | european | y | E:\vannan\IPFTMA5_HE\image_export\A2.ome.tif |
| 2 | 169485b8 | 24909 | CustomPanel | TMA | A3 | Disease | ILD | european | n | E:\vannan\IPFTMA5_HE\image_export\A3.ome.tif |
| 3 | a7059e74 | 24909 | CustomPanel | TMA | B1 | Control | IPF | african american | n | E:\vannan\IPFTMA5_HE\image_export\B1.ome.tif |
| 4 | 8e9d8c12 | 24909 | CustomPanel | TMA | B2 | Control | control | hispanic | y | E:\vannan\IPFTMA5_HE\image_export\B2.ome.tif |
| 5 | e1d7f9bc | 24909 | CustomPanel | TMA | B3 | Disease | NSIP | european | y | E:\vannan\IPFTMA5_HE\image_export\B3.ome.tif |
Automated image registration on the whole InSituExperiment object we can perform by combining the register_images function and .iterdata():
from insitupy.tools import register_images
for meta, data in exp.iterdata():
    name = meta["region_name"]
    print(name)
    he_path = meta["HE_path"]

    register_images(
        data=data,
        image_to_be_registered=he_path,
        axes_image="YXS",
        channel_names='HE',
        template_image_name="nuclei",
        axes_template="YX",
        save_registered_images=True,
        output_dir=data_out.parent / f"registered_images/{name}"
    )
A1
	Processing following histo images: HE
		Loading images to be registered...
		Run color deconvolution on image
Load and scale image data containing all channels.
		Load image into memory...
		Load template into memory...
		Rescale image and template to save memory.
			Rescaled from (7343, 5960, 3) to following dimensions: (4439, 3602, 3)
			Rescaled from (14114, 17609) to following dimensions: (3580, 4467)
		Convert scaled images to 8 bit
Load and scale image data containing only the channels required for registration.
		Rescale image and template to save memory.
			Rescaled from (7340, 5960) to following dimensions: (4438, 3603)
			Rescaled from (14114, 17609) to following dimensions: (3580, 4467)
		Convert scaled images to 8 bit
		Extract common features from image and template
		2025-12-22 14:22:37: Get features...
			Adjust contrast with clip method...
			Method: SIFT...
		2025-12-22 14:22:48: Compute matches...
		2025-12-22 14:23:04: Filter matches...
			Sufficient number of good matches found (3597/56).
		2025-12-22 14:23:04: Display matches...
		2025-12-22 14:23:05: Fetch keypoints...
		2025-12-22 14:23:05: Estimate 2D affine transformation matrix...
		2025-12-22 14:23:05: Register image by affine transformation...
		Save OME-TIFF to E:\vannan\registered_images\A1\registered_images\0024909__CustomPanel__HE__registered.ome.tif
		Save QC files to E:\vannan\registered_images\A1\registered_images\registration_qc
A2
	Processing following histo images: HE
		Loading images to be registered...
		Run color deconvolution on image
Load and scale image data containing all channels.
		Load image into memory...
		Load template into memory...
		Rescale image and template to save memory.
			Rescaled from (6950, 5547, 3) to following dimensions: (4477, 3573, 3)
			Rescaled from (13733, 16298) to following dimensions: (3671, 4357)
		Convert scaled images to 8 bit
Load and scale image data containing only the channels required for registration.
		Rescale image and template to save memory.
			Rescaled from (6950, 5545) to following dimensions: (4478, 3572)
			Rescaled from (13733, 16298) to following dimensions: (3671, 4357)
		Convert scaled images to 8 bit
		Extract common features from image and template
		2025-12-22 14:23:16: Get features...
			Adjust contrast with clip method...
			Method: SIFT...
		2025-12-22 14:23:26: Compute matches...
		2025-12-22 14:23:41: Filter matches...
			Sufficient number of good matches found (2257/50).
		2025-12-22 14:23:41: Display matches...
		2025-12-22 14:23:42: Fetch keypoints...
		2025-12-22 14:23:42: Estimate 2D affine transformation matrix...
		2025-12-22 14:23:42: Register image by affine transformation...
		Save OME-TIFF to E:\vannan\registered_images\A2\registered_images\0024909__CustomPanel__HE__registered.ome.tif
		Save QC files to E:\vannan\registered_images\A2\registered_images\registration_qc
A3
	Processing following histo images: HE
		Loading images to be registered...
		Run color deconvolution on image
Load and scale image data containing all channels.
		Load image into memory...
		Load template into memory...
		Rescale image and template to save memory.
			Rescaled from (6720, 7362, 3) to following dimensions: (3820, 4186, 3)
			Rescaled from (16798, 13726) to following dimensions: (4425, 3615)
		Convert scaled images to 8 bit
Load and scale image data containing only the channels required for registration.
		Rescale image and template to save memory.
			Rescaled from (6720, 7360) to following dimensions: (3822, 4186)
			Rescaled from (16798, 13726) to following dimensions: (4425, 3615)
		Convert scaled images to 8 bit
		Extract common features from image and template
		2025-12-22 14:25:46: Get features...
			Adjust contrast with clip method...
			Method: SIFT...
		2025-12-22 14:25:57: Compute matches...
		2025-12-22 14:26:16: Filter matches...
			Sufficient number of good matches found (3853/52).
		2025-12-22 14:26:16: Display matches...
		2025-12-22 14:26:19: Fetch keypoints...
		2025-12-22 14:26:19: Estimate 2D affine transformation matrix...
		2025-12-22 14:26:19: Register image by affine transformation...
		Save OME-TIFF to E:\vannan\registered_images\A3\registered_images\0024909__CustomPanel__HE__registered.ome.tif
		Save QC files to E:\vannan\registered_images\A3\registered_images\registration_qc
B1
	Processing following histo images: HE
		Loading images to be registered...
		Run color deconvolution on image
Load and scale image data containing all channels.
		Load image into memory...
		Load template into memory...
		Rescale image and template to save memory.
			Rescaled from (7784, 7327, 3) to following dimensions: (4122, 3879, 3)
			Rescaled from (17117, 18332) to following dimensions: (3864, 4139)
		Convert scaled images to 8 bit
Load and scale image data containing only the channels required for registration.
		Rescale image and template to save memory.
			Rescaled from (7780, 7325) to following dimensions: (4122, 3880)
			Rescaled from (17117, 18332) to following dimensions: (3864, 4139)
		Convert scaled images to 8 bit
		Extract common features from image and template
		2025-12-22 14:28:50: Get features...
			Adjust contrast with clip method...
			Method: SIFT...
		2025-12-22 14:29:01: Compute matches...
		2025-12-22 14:29:27: Filter matches...
			Sufficient number of good matches found (15021/70).
		2025-12-22 14:29:27: Display matches...
		2025-12-22 14:29:32: Fetch keypoints...
		2025-12-22 14:29:32: Estimate 2D affine transformation matrix...
		2025-12-22 14:29:32: Register image by affine transformation...
		Save OME-TIFF to E:\vannan\registered_images\B1\registered_images\0024909__CustomPanel__HE__registered.ome.tif
		Save QC files to E:\vannan\registered_images\B1\registered_images\registration_qc
B2
	Processing following histo images: HE
		Loading images to be registered...
		Run color deconvolution on image
Load and scale image data containing all channels.
		Load image into memory...
		Load template into memory...
		Rescale image and template to save memory.
			Rescaled from (6947, 6125, 3) to following dimensions: (4259, 3755, 3)
			Rescaled from (14918, 17005) to following dimensions: (3745, 4270)
		Convert scaled images to 8 bit
Load and scale image data containing only the channels required for registration.
		Rescale image and template to save memory.
			Rescaled from (6945, 6125) to following dimensions: (4259, 3756)
			Rescaled from (14918, 17005) to following dimensions: (3745, 4270)
		Convert scaled images to 8 bit
		Extract common features from image and template
		2025-12-22 14:29:45: Get features...
			Adjust contrast with clip method...
			Method: SIFT...
		2025-12-22 14:29:56: Compute matches...
		2025-12-22 14:30:13: Filter matches...
			Sufficient number of good matches found (6932/57).
		2025-12-22 14:30:13: Display matches...
		2025-12-22 14:30:15: Fetch keypoints...
		2025-12-22 14:30:15: Estimate 2D affine transformation matrix...
		2025-12-22 14:30:15: Register image by affine transformation...
		Save OME-TIFF to E:\vannan\registered_images\B2\registered_images\0024909__CustomPanel__HE__registered.ome.tif
		Save QC files to E:\vannan\registered_images\B2\registered_images\registration_qc
B3
	Processing following histo images: HE
		Loading images to be registered...
		Run color deconvolution on image
Load and scale image data containing all channels.
		Load image into memory...
		Load template into memory...
		Rescale image and template to save memory.
			Rescaled from (6848, 6968, 3) to following dimensions: (3964, 4034, 3)
			Rescaled from (16632, 15291) to following dimensions: (4171, 3834)
		Convert scaled images to 8 bit
Load and scale image data containing only the channels required for registration.
		Rescale image and template to save memory.
			Rescaled from (6845, 6965) to following dimensions: (3964, 4034)
			Rescaled from (16632, 15291) to following dimensions: (4171, 3834)
		Convert scaled images to 8 bit
		Extract common features from image and template
		2025-12-22 14:30:27: Get features...
			Adjust contrast with clip method...
			Method: SIFT...
		2025-12-22 14:30:37: Compute matches...
		2025-12-22 14:31:00: Filter matches...
			Sufficient number of good matches found (9500/57).
		2025-12-22 14:31:00: Display matches...
		2025-12-22 14:31:03: Fetch keypoints...
		2025-12-22 14:31:03: Estimate 2D affine transformation matrix...
		2025-12-22 14:31:03: Register image by affine transformation...
		Save OME-TIFF to E:\vannan\registered_images\B3\registered_images\0024909__CustomPanel__HE__registered.ome.tif
		Save QC files to E:\vannan\registered_images\B3\registered_images\registration_qc
exp
InSituExperiment (insitupy mode) with 6 samples:
           uid  CITAR  slide_id    sample_id region_key  ...   status clinical_diagnosis       ethnicity tobacco         HE_path
0     1097134d  ++--+     24909  CustomPanel        TMA  ...  Control         control           european       y  E:\vannan\I...
1     5a16ef86  ++--+     24909  CustomPanel        TMA  ...  Disease             IPF           european       y  E:\vannan\I...
2     169485b8  ++--+     24909  CustomPanel        TMA  ...  Disease             ILD           european       n  E:\vannan\I...
3     a7059e74  ++--+     24909  CustomPanel        TMA  ...  Control             IPF     african ame...       n  E:\vannan\I...
4     8e9d8c12  ++--+     24909  CustomPanel        TMA  ...  Control         control           hispanic       y  E:\vannan\I...
5     e1d7f9bc  ++--+     24909  CustomPanel        TMA  ...  Disease            NSIP           european       y  E:\vannan\I...
Remove the metadata column with the HE image paths again:
exp.remove_metadata_columns("HE_path")
Save the InSituExperiment again using saveas to include also the registered images. Importantly, using save() would not store the registered images, since images are not “variable data” in InSituPy.
data_out_he = data_out.parent / "IPFTMA5_HE_insitupy"
exp.saveas(data_out_he)
exp = InSituExperiment.read(data_out_he)
exp.load_all()
exp
InSituExperiment (insitupy mode) with 6 samples:
           uid  CITAR  slide_id    sample_id region_key region_name   status clinical_diagnosis       ethnicity tobacco
0     1097134d  ++--+     24909  CustomPanel        TMA          A1  Control         control           european       y
1     5a16ef86  ++--+     24909  CustomPanel        TMA          A2  Disease             IPF           european       y
2     169485b8  ++--+     24909  CustomPanel        TMA          A3  Disease             ILD           european       n
3     a7059e74  ++--+     24909  CustomPanel        TMA          B1  Control             IPF     african ame...       n
4     8e9d8c12  ++--+     24909  CustomPanel        TMA          B2  Control         control           hispanic       y
5     e1d7f9bc  ++--+     24909  CustomPanel        TMA          B3  Disease            NSIP           european       y
spatial(
    data=exp,
    keys="leiden",
    max_cols=3,
    image_key="HE",
    savepath="figures/spatial_leiden_HE.pdf"
    )
Key 'leiden' found already in `exp.colors`. To overwrite it, run `sync_colors` with `overwrite=True`.