Automated image registration#
This notebook demonstrates the registration of images from H&E, IHC or IF stainings that were performed on the same slide as the Xenium In Situ measurements. It is assumed that the images which are about to be registered, contain the same tissue as the spatial transcriptomics data.
## The following code ensures that all functions and init files are reloaded before executions.
%load_ext autoreload
%autoreload 2
from pathlib import Path
from insitupy import CACHE
from insitupy.io import read_xenium
from insitupy.tools import register_images
Load Xenium data into InSituData object#
Now the Xenium data can be parsed by providing the data path to InSituData using the read_xenium function or directly using the downloading function.
Load the dataset directly from the downloading function…#
from insitupy.datasets import xenium_human_breast_cancer
xd = xenium_human_breast_cancer()
This dataset exists already. Download is skipped. To force download set `overwrite=True`.
Image exists. Checking md5sum...
The md5sum matches. Download is skipped. To force download set `overwrite=True`.
Image exists. Checking md5sum...
The md5sum matches. Download is skipped. To force download set `overwrite=True`.
Corresponding image data can be found in C:\Users\ge37voy\.cache\InSituPy\demo_datasets\xenium_hbreastcancer\unregistered_images
For this dataset following images are available:
slide_id__hbreastcancer__HE__histo.ome.tiff
slide_id__hbreastcancer__CD20_HER2_DAPI__IF.ome.tiff
2026-02-23 21:32:00 | [INFO] Reading Xenium data with InSituPy backend...
Loading cells...
Loading images...
Loading transcripts...
… or use the read_xenium function and the path to the Xenium data directory if the dataset has already been downloaded#
xd = read_xenium(CACHE / "demo_datasets/xenium_hbreastcancer/output-XETG00000__slide_id__hbreastcancer")
2026-02-23 21:32:04 | [INFO] Reading Xenium data with InSituPy backend...
Loading cells...
Loading images...
Loading transcripts...
xd
InSituData
Method:		Xenium
Slide ID:	0001879
Sample ID:	Replicate 1
Path:		C:\Users\ge37voy\.cache\InSituPy\demo_datasets\xenium_hbreastcancer\output-XETG00000__slide_id__hbreastcancer

    ➤ images
       'nuclei':   (25778, 35416)
    ➤ cells
       MultiCellData with main layer 'main'
           table
               AnnData object with n_obs × n_vars = 167780 × 313
               obs: 'transcript_counts', 'control_probe_counts', 'control_codeword_counts', 'total_counts', 'cell_area', 'nucleus_area'
               var: 'gene_ids', 'feature_types', 'genome'
               obsm: 'spatial'
           boundaries
               BoundariesData object with 2 entries:
                   cells
                   nuclei
    ➤ transcripts
       DataFrame with shape <dask_expr.expr.Scalar: expr=ReadParquetFSSpec(802c29c).size() // 8, dtype=int64> x 8
Prepare the paths to the unregistered images#
Here the unregistered images were downloaded by the human_breast_cancer downloading function and saved in a folder unregistered_images.
# prepare paths
if_to_be_registered = CACHE / "demo_datasets/xenium_hbreastcancer" / "unregistered_images/slide_id__hbreastcancer__CD20_HER2_DAPI__IF.ome.tif"
he_to_be_registered = CACHE / "demo_datasets/xenium_hbreastcancer" / "unregistered_images/slide_id__hbreastcancer__HE__histo.ome.tif"
Automated Registration of Images#
Overview:
Xenium In Situ is a non-destructive method that allows for staining and imaging of tissue after in situ sequencing analysis. This process is performed outside the Xenium machine and requires subsequent registration. InSituPy provides an automatic image registration pipeline based on the Scale-Invariant Feature Transform (SIFT) algorithm.
Process:
Feature Detection:
The SIFT algorithm detects common features between the template (Xenium DAPI image) and the acquired images.
These features are used to calculate a transformation matrix.
The transformation matrix registers the images to the template.
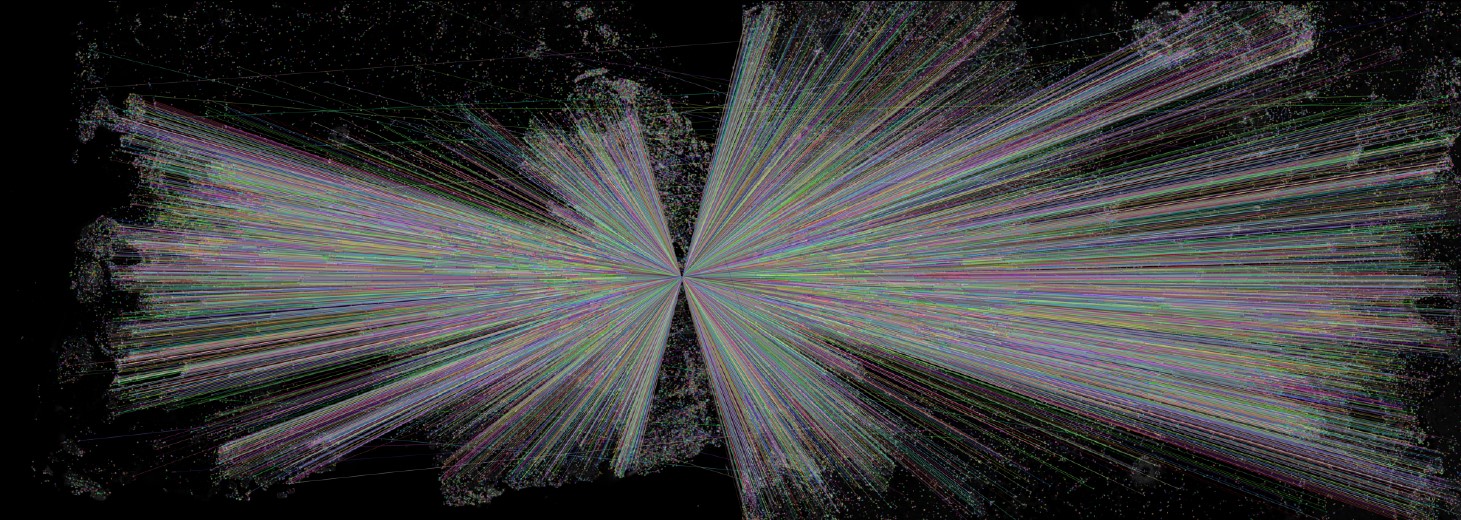
Common features extracted by SIFT algorithm
Preprocessing Steps:
Histological Images (H&E or IHC):
These techniques produce RGB images.
Color deconvolution extracts the hematoxylin channel containing the nuclei for registration with the Xenium DAPI image.
Immunofluorescence (IF) Images:
This method results in multiple grayscale images.
One channel must contain a nuclei stain (e.g., DAPI).
This channel is selected for SIFT feature detection and transformation matrix calculation.
Other channels are registered using the same transformation matrix.
Cropping of Images from Whole Slide Images#
Workflow: In a Xenium In Situ workflow, a slide often contains multiple tissue sections. While spatial transcriptomics data is separated during the run, histological stainings contain all sections in one whole slide image. To extract individual images of histologically stained tissue sections, two workflows are recommended:
QuPath Annotation:
Annotate and name individual tissue sections in QuPath.
Use the
.groovyscript inInSituPy/scripts/export_annotations_OME-TIFF.groovy.
Napari-Based Approach:
Demonstrated in
XX_InSituPy_extract_individual_images.ipynb.
Input Files#
Formats:
.tif or .ome.tif formats are accepted.
IF Images:
Multi-channel images are expected.
Specify channel names using the
channel_namesargument.Specify the channel containing nuclei staining with the
channel_name_for_registrationargument (e.g., DAPI channel).
HE Images:
Expected to be RGB images.
Cropping methods should result in the correct image format.
Output Generated by the Registration Pipeline#
Registered Images:
If
save_registered_images==True, registered images are saved as.ome.tifin theregistered_imagesfolder in the parent directory of the Xenium data.File naming convention:
slide_id__sample_id__name__registered.ome.tif.
Transformation Matrix:
Saved as
.csvin theregistration_qcfolder within theregistered_imagesfolder.File name ends with
__T.pdf.
Common Features:
Representation of common features between the registered image and the template.
Saved as
.pdfin theregistration_qcfolder.File name ends with
__common_features.
Directory Structure:
./demo_dataset
├───output-XETG00000__slide_id__sample_id
├───registered_images
│   │   slide_id__sample_id__name__registered.ome.tif
│   ├───registration_qc
│   │       slide_id__sample_id__name__T.csv
│   │       slide_id__sample_id__name__common_features.pdf
└───unregistered_images
Registration of IF images#
register_images(
    data=xd,
    image_to_be_registered=if_to_be_registered,
    axes_image="CYX",
    channel_names=['CD20', 'HER2', 'DAPI'],
    channel_name_for_registration="DAPI",
    template_image_name="nuclei",
    axes_template="YX",
    save_registered_images=True
    )
━━━━━━━━━━━━━━━━━━━━━━━━━━━━━━━━━━━━━━━━━━━━━━━━━━━━━━━━━━━━━━━━━━━━━━━━━━━━━━━━
Registration: 0001879__Replicate 1 ── CD20, HER2, DAPI (IF)
━━━━━━━━━━━━━━━━━━━━━━━━━━━━━━━━━━━━━━━━━━━━━━━━━━━━━━━━━━━━━━━━━━━━━━━━━━━━━━━━
  ├── Loading images
  │     Image:    (3, 9777, 14239)
  │     Template: (25778, 35416)
  ├── Selecting nuclei channel (index: 2)
  ├── Loading images into memory
  ├── Scaling
  │     Image:    (3, 9777, 14239) → (3, 3314, 4827)
  │     Template: (25778, 35416) → (3412, 4688)
  ├── Scaling
  │     Image:    (9777, 14239) → (3314, 4827)
  │     Template: (25778, 35416) → (3412, 4688)
  ├── Feature extraction (SIFT, contrast: clip)
  │     Good matches: 37040 / 206 required  ✔
  ├── Transformation matrix (affine)
  ├── Registering channel: CD20
  ├── Registration
  ├── Saving
  │     Image: C:\Users\ge37voy\.cache\InSituPy\demo_datasets\xenium_hbreastcancer\registered_images\0001879__Replicate 1__CD20__registered.ome.tif
  │     QC:    C:\Users\ge37voy\.cache\InSituPy\demo_datasets\xenium_hbreastcancer\registered_images\registration_qc
  ├── Registering channel: HER2
  ├── Registration
  ├── Saving
  │     Image: C:\Users\ge37voy\.cache\InSituPy\demo_datasets\xenium_hbreastcancer\registered_images\0001879__Replicate 1__HER2__registered.ome.tif
  │     QC:    C:\Users\ge37voy\.cache\InSituPy\demo_datasets\xenium_hbreastcancer\registered_images\registration_qc
  └── Done (81.0 s, peak memory: 5.08 GB)
xd
InSituData
Method:		Xenium
Slide ID:	0001879
Sample ID:	Replicate 1
Path:		C:\Users\ge37voy\.cache\InSituPy\demo_datasets\xenium_hbreastcancer\output-XETG00000__slide_id__hbreastcancer

    ➤ images
       'nuclei':   (25778, 35416)
       'CD20':     (25778, 35416)
       'HER2':     (25778, 35416)
    ➤ cells
       MultiCellData with main layer 'main'
           table
               AnnData object with n_obs × n_vars = 167780 × 313
               obs: 'transcript_counts', 'control_probe_counts', 'control_codeword_counts', 'total_counts', 'cell_area', 'nucleus_area'
               var: 'gene_ids', 'feature_types', 'genome'
               obsm: 'spatial'
           boundaries
               BoundariesData object with 2 entries:
                   cells
                   nuclei
    ➤ transcripts
       DataFrame with shape <dask_expr.expr.Scalar: expr=ReadParquetFSSpec(802c29c).size() // 8, dtype=int64> x 8
Adding individual channels#
The example above shows how to deal with multi-channel IF images where one channel contains nuclei information and can therefore be used to register the images automatically. In alternative scenarios, one might have single-channel images and wants to add those to the InSituData. In such cases one needs the transformation matrix to align the image with the existing InSituData and then can add the image using ImageData’s add_image function as shown in the example below.
# read the multi-channel image and extract an individual channel for demonstration
from insitupy.images.io import read_image
img_pyramid, ome_meta, axes, pixel_size = read_image(if_to_be_registered)
img = img_pyramid[0] # select highest resolution
img_ch = img[0, :, :]
img_ch
|
||||||||||||||||
# read the transformation matrix from the previous registration
transformation_matrix = CACHE / "demo_datasets/xenium_hbreastcancer/registered_images/registration_qc/0001879__Replicate 1__CD20__T.csv"
Add the image to the ImageData object and specify the transformation matrix:
xd.images.add_image(
    image=img_ch,
    channel_names="CD20_2",
    axes="YX",
    pixel_size=pixel_size,
    transformation_matrix=transformation_matrix,
    reference_image="nuclei",
    overwrite=True
)
Applying transformation to image 'CD20_2'...
Using reference image 'nuclei' (pixel size: 0.2125 µm/pixel, shape: 25778x35416 pixels = 5477.8x7525.9 µm)
Converted transformation matrix from pixel coordinates (reference: 0.2125 µm/pixel) to physical coordinates.
Applying transformation matrix (in physical coordinates):
[[-3.47580326e+00  2.48591853e-02  9.02645355e+03]
 [-2.45060970e-02 -3.47891712e+00  6.88766822e+03]]
Transforming image 'CD20_2' with shape (9777, 14239) -> output size (35416, 25778)
Transformed image 'CD20_2'
Transformed 1 images.
The single image has been added to the ImageData object and results can be visualized using xd.show().
xd.images
'nuclei':   (25778, 35416)
'CD20':     (25778, 35416)
'HER2':     (25778, 35416)
'CD20_2':   (25778, 35416)
xd.show()
2026-02-23 21:34:34 | [INFO] Extracting unique gene names from Dask DataFrame...
2026-02-23 21:34:43 | [INFO] Found 541 unique genes
2026-02-23 21:35:34 | [INFO] Loading coordinates for gene 'ACTA2'...
2026-02-23 21:35:40 | [INFO] Loaded 439233 coordinates for gene 'ACTA2'
Remove the additional CD20 image again.
del xd.images['CD20_2']
xd.images
'nuclei':   (25778, 35416)
'CD20':     (25778, 35416)
'HER2':     (25778, 35416)
Registration of H&E images#
register_images(
    data=xd,
    image_to_be_registered=he_to_be_registered,
    axes_image="YXS",
    channel_names='HE',
    template_image_name="nuclei",
    axes_template="YX",
    save_registered_images=True,
    )
━━━━━━━━━━━━━━━━━━━━━━━━━━━━━━━━━━━━━━━━━━━━━━━━━━━━━━━━━━━━━━━━━━━━━━━━━━━━━━━━
Registration: 0001879__Replicate 1 ── HE (histo)
━━━━━━━━━━━━━━━━━━━━━━━━━━━━━━━━━━━━━━━━━━━━━━━━━━━━━━━━━━━━━━━━━━━━━━━━━━━━━━━━
  ├── Loading images
  │     Image:    (24241, 30786, 3)
  │     Template: (25778, 35416)
  ├── Color deconvolution (scale factor: 0.2)
  ├── Loading images into memory
  ├── Scaling
  │     Image:    (24241, 30786, 3) → (3548, 4507, 3)
  │     Template: (25778, 35416) → (3412, 4688)
  ├── Scaling
  │     Image:    (24240, 30785) → (3548, 4507)
  │     Template: (25778, 35416) → (3412, 4688)
  ├── Feature extraction (SIFT, contrast: clip)
  │     Good matches: 123 / 206 required (insufficient, testing flip)
  │     Testing vertical flip
  │     Good matches: 28728 / 206 required  ✔
  ├── Transformation matrix (affine)
  │     Applying vertically flip
  ├── Registration
  ├── Saving
  │     Image: C:\Users\ge37voy\.cache\InSituPy\demo_datasets\xenium_hbreastcancer\registered_images\0001879__Replicate 1__HE__registered.ome.tif
  │     QC:    C:\Users\ge37voy\.cache\InSituPy\demo_datasets\xenium_hbreastcancer\registered_images\registration_qc
  └── Done (97.2 s, peak memory: 9.10 GB)
xd
InSituData
Method:		Xenium
Slide ID:	0001879
Sample ID:	Replicate 1
Path:		C:\Users\ge37voy\.cache\InSituPy\demo_datasets\xenium_hbreastcancer\output-XETG00000__slide_id__hbreastcancer

    ➤ images
       'nuclei':   (25778, 35416)
       'CD20':     (25778, 35416)
       'HER2':     (25778, 35416)
       'HE':       (25778, 35416, 3)
    ➤ cells
       MultiCellData with main layer 'main'
           table
               AnnData object with n_obs × n_vars = 167780 × 313
               obs: 'transcript_counts', 'control_probe_counts', 'control_codeword_counts', 'total_counts', 'cell_area', 'nucleus_area'
               var: 'gene_ids', 'feature_types', 'genome'
               obsm: 'spatial'
           boundaries
               BoundariesData object with 2 entries:
                   cells
                   nuclei
    ➤ transcripts
       DataFrame with shape <dask_expr.expr.Scalar: expr=ReadParquetFSSpec(802c29c).size() // 8, dtype=int64> x 8
Visualize the aligned images.
xd.show()
2026-02-23 21:38:34 | [INFO] Extracting unique gene names from Dask DataFrame...
2026-02-23 21:38:40 | [INFO] Found 541 unique genes
Working with an InSituPy project#
To allow a simple and structured saving workflow, InSituPy provides two saving functions:
saveas()save()
Save as InSituPy project#
insitupy_project = Path(CACHE / "out/demo_insitupy_project")
xd.saveas(insitupy_project, overwrite=True)
Saving data to C:\Users\ge37voy\.cache\InSituPy\out\demo_insitupy_project
Saved.
Save InSituPy project with downscaled image data#
Since the image data is very large and not required during most of the trancriptomic analysis, we can downscale the image data to save disk space.
insitupy_project_downscaled = Path(CACHE / "out/demo_insitupy_project_downscaled")
xd.saveas(
    insitupy_project_downscaled,
    images_max_resolution=1, # in µm/pixel
    overwrite=True
    )
Saving data to C:\Users\ge37voy\.cache\InSituPy\out\demo_insitupy_project_downscaled
Saved.
Reload from InSituPy project#
From the InSituPy project we can now load only the modalities that we need for later analyses. Due to an optimized file structure using zarr and dask, this makes loading and visualization of the data more efficient compared to doing this directly from the xenium data bundle.
from insitupy import InSituData
xd = InSituData.read(insitupy_project)
xd_ds = InSituData.read(insitupy_project_downscaled)
xd
InSituData
Method:		Xenium
Slide ID:	0001879
Sample ID:	Replicate 1
Path:		C:\Users\ge37voy\.cache\InSituPy\out\demo_insitupy_project


No modalities loaded.
xd_ds
InSituData
Method:		Xenium
Slide ID:	0001879
Sample ID:	Replicate 1
Path:		C:\Users\ge37voy\.cache\InSituPy\out\demo_insitupy_project_downscaled


No modalities loaded.
Load all required modalities#
Next, we have to make sure that all data modalities that are required for the subsequent analyses are loaded. In our case it is the cellular data and the image data. If a modality is missing, one can load it with .load_{modality}.
Load selected modalities of down-scaled data:
xd_ds.load_cells()
xd_ds.load_images()
xd_ds
InSituData
Method:		Xenium
Slide ID:	0001879
Sample ID:	Replicate 1
Path:		C:\Users\ge37voy\.cache\InSituPy\out\demo_insitupy_project_downscaled

    ➤ images
       'CD20':     (5477, 7525)
       'HE':       (5477, 7525, 3)
       'HER2':     (5477, 7525)
       'nuclei':   (5477, 7525)
    ➤ cells
       MultiCellData with main layer 'main'
           table
               AnnData object with n_obs × n_vars = 167780 × 313
               obs: 'transcript_counts', 'control_probe_counts', 'control_codeword_counts', 'total_counts', 'cell_area', 'nucleus_area'
               var: 'gene_ids', 'feature_types', 'genome'
               obsm: 'spatial'
           boundaries
               BoundariesData object with 2 entries:
                   cells
                   nuclei
xd_ds.show()
Load all modalities but the transcripts of the full scale data:
xd.load_all(skip="transcripts")
xd
InSituData
Method:		Xenium
Slide ID:	0001879
Sample ID:	Replicate 1
Path:		C:\Users\ge37voy\.cache\InSituPy\out\demo_insitupy_project

    ➤ images
       'CD20':     (25778, 35416)
       'HE':       (25778, 35416, 3)
       'HER2':     (25778, 35416)
       'nuclei':   (25778, 35416)
    ➤ cells
       MultiCellData with main layer 'main'
           table
               AnnData object with n_obs × n_vars = 167780 × 313
               obs: 'transcript_counts', 'control_probe_counts', 'control_codeword_counts', 'total_counts', 'cell_area', 'nucleus_area'
               var: 'gene_ids', 'feature_types', 'genome'
               obsm: 'spatial'
           boundaries
               BoundariesData object with 2 entries:
                   cells
                   nuclei
xd.show()