Performing pseudobulking on the InSituExperiment object#
## The following code ensures that all functions and init files are reloaded before executions.
%load_ext autoreload
%autoreload 2
The autoreload extension is already loaded. To reload it, use:
  %reload_ext autoreload
from pathlib import Path
from insitupy import InSituData, InSituExperiment, CACHE
import warnings
warnings.simplefilter(action='ignore', category=FutureWarning)
Load Xenium data into InSituData object#
Now the Xenium data can be parsed by providing the data path to the InSituPy project folder.
insitupy_project = Path(CACHE / "out/demo_insitupy_project")
xd = InSituData.read(insitupy_project)
xd.load_all(skip="transcripts")
xd
InSituData
Method:		Xenium
Slide ID:	0001879
Sample ID:	Replicate 1
Path:		C:\Users\ge37voy\.cache\InSituPy\out\demo_insitupy_project

    ➤ images
       CD20:	(25778, 35416)
       HE:	(25778, 35416, 3)
       HER2:	(25778, 35416)
       nuclei:	(25778, 35416)
    ➤ cells
       MultiCellData with main layer 'main'
           matrix
               AnnData object with n_obs × n_vars = 156447 × 297
               obs: 'transcript_counts', 'control_probe_counts', 'control_codeword_counts', 'total_counts', 'cell_area', 'nucleus_area', 'n_genes_by_counts', 'n_genes', 'leiden', 'cell_type_dc', 'cell_type_dc_sub', 'cell_type_tacco', 'cell_type_publ_x', 'cell_type_publ_y', 'cell_type_dc_sub_final', 'cell_type_publ'
               var: 'gene_ids', 'feature_types', 'genome', 'n_cells_by_counts', 'mean_counts', 'pct_dropout_by_counts', 'total_counts', 'n_cells'
               uns: 'cell_type_dc_colors', 'cell_type_dc_sub', 'cell_type_dc_sub_colors', 'cell_type_dc_sub_final_colors', 'cell_type_publ_colors', 'cell_type_tacco_colors', 'counts_location', 'leiden', 'leiden_colors', 'log1p', 'neighbors', 'pca', 'umap'
               obsm: 'OT', 'X_pca', 'X_umap', 'annotations', 'ora_estimate', 'ora_pvals', 'regions', 'spatial'
               varm: 'OT', 'PCs'
               layers: 'counts', 'norm_counts'
               obsp: 'connectivities', 'distances'
           boundaries
               BoundariesData object with 2 entries:
                   cells
                   nuclei
    ➤ annotations
       TestKey:	5 annotations, 2 classes ('TestClass', 'test') ✔
       demo:	28 annotations, 2 classes ('Stroma', 'Tumor cells') ✔
       demo2:	5 annotations, 3 classes ('Negative', 'Other', 'Positive') ✔
       demo3:	7 annotations, 5 classes ('Immune cells', 'Necrosis', 'Stroma', 'Tumor', 'unclassified') ✔
       Demo:	28 annotations, 2 classes ('Stroma', 'Tumor cells') ✔
       Janesick:	18 annotations, 3 classes ('DCIS #1', 'DCIS #2', 'Invasive')
       Katja:	18 annotations, 4 classes ('DCIS', 'DCIS intermediate', 'DCIS with stromal reaction', 'Invasive') ✔
    ➤ regions
       demo_regions:	3 regions, 3 classes ('Region1', 'Region2', 'Region3') ✔
       TMA:	6 regions, 6 classes ('A-1', 'A-2', 'A-3', 'B-1', 'B-2', 'B-3') ✔
       Demo:	3 regions, 3 classes ('Region 1', 'Region 2', 'Region 3') ✔
       Katja:	4 regions, 4 classes ('Region 1', 'Region 2', 'Region 3', 'Region 4') ✔
Create InSituExperiment from regions#
exp = InSituExperiment.from_regions(
    data=xd, region_key="TMA"
)
A-1
A-2
A-3
B-1
B-2
B-3
exp
InSituExperiment with 6 samples:
           uid  CITAR slide_id    sample_id region_key region_name
0     cd61d9fc  ++-++  0001879  Replicate 1        TMA         A-1
1     254b31d5  ++-++  0001879  Replicate 1        TMA         A-2
2     55d07bd6  ++-++  0001879  Replicate 1        TMA         A-3
3     9f4a2a5c  ++-++  0001879  Replicate 1        TMA         B-1
4     c3478b1a  ++-++  0001879  Replicate 1        TMA         B-2
5     1accc48d  ++-++  0001879  Replicate 1        TMA         B-3
from insitupy.tools import generate_pseudobulk
psbulk = generate_pseudobulk(
    exp,
    sample_col='batch',
    groups_col='cell_type_dc_sub_final',
    counts_layer='counts',
    mode='sum',
    min_cells=10,
    min_counts=1000,
    skip_checks=False,
    min_prop=None,
    min_smpls=None,
    remove_empty=True
    )
psbulk
AnnData object with n_obs × n_vars = 60 × 297
    obs: 'batch', 'cell_type_dc_sub_final', 'psbulk_cells', 'psbulk_counts'
    layers: 'psbulk_props'
psbulk.obs
| batch | cell_type_dc_sub_final | psbulk_cells | psbulk_counts | |
|---|---|---|---|---|
| 9f4a2a5c-Adipocytes | 9f4a2a5c | Adipocytes | 11.0 | 2728.0 |
| 1accc48d-B cells | 1accc48d | B cells | 184.0 | 30929.0 |
| 254b31d5-B cells | 254b31d5 | B cells | 29.0 | 6606.0 |
| 55d07bd6-B cells | 55d07bd6 | B cells | 67.0 | 13314.0 |
| 9f4a2a5c-B cells | 9f4a2a5c | B cells | 110.0 | 18702.0 |
| c3478b1a-B cells | c3478b1a | B cells | 178.0 | 33777.0 |
| cd61d9fc-B cells | cd61d9fc | B cells | 86.0 | 12128.0 |
| 254b31d5-Breast cancer subtype 1 | 254b31d5 | Breast cancer subtype 1 | 967.0 | 213588.0 |
| 55d07bd6-Breast cancer subtype 1 | 55d07bd6 | Breast cancer subtype 1 | 83.0 | 23719.0 |
| 9f4a2a5c-Breast cancer subtype 1 | 9f4a2a5c | Breast cancer subtype 1 | 1742.0 | 486409.0 |
| cd61d9fc-Breast cancer subtype 1 | cd61d9fc | Breast cancer subtype 1 | 568.0 | 132467.0 |
| 1accc48d-Breast cancer subtype 2 | 1accc48d | Breast cancer subtype 2 | 1100.0 | 304413.0 |
| 55d07bd6-Breast cancer subtype 2 | 55d07bd6 | Breast cancer subtype 2 | 457.0 | 128867.0 |
| cd61d9fc-Breast cancer subtype 2 | cd61d9fc | Breast cancer subtype 2 | 76.0 | 10725.0 |
| 254b31d5-Breast cancer subtype 3 | 254b31d5 | Breast cancer subtype 3 | 92.0 | 21515.0 |
| 55d07bd6-Breast cancer subtype 3 | 55d07bd6 | Breast cancer subtype 3 | 19.0 | 5005.0 |
| 9f4a2a5c-Breast cancer subtype 3 | 9f4a2a5c | Breast cancer subtype 3 | 364.0 | 111390.0 |
| cd61d9fc-Breast cancer subtype 3 | cd61d9fc | Breast cancer subtype 3 | 50.0 | 13919.0 |
| cd61d9fc-Breast cancer subtype 4 | cd61d9fc | Breast cancer subtype 4 | 2379.0 | 528355.0 |
| 1accc48d-Breast cancer subtype 5 | 1accc48d | Breast cancer subtype 5 | 12.0 | 1098.0 |
| 55d07bd6-Breast cancer subtype 5 | 55d07bd6 | Breast cancer subtype 5 | 15.0 | 3801.0 |
| c3478b1a-Breast cancer subtype 5 | c3478b1a | Breast cancer subtype 5 | 150.0 | 46621.0 |
| cd61d9fc-Breast cancer subtype 5 | cd61d9fc | Breast cancer subtype 5 | 258.0 | 34030.0 |
| 1accc48d-Breast glandular cells | 1accc48d | Breast glandular cells | 312.0 | 81856.0 |
| 55d07bd6-Breast glandular cells | 55d07bd6 | Breast glandular cells | 31.0 | 6962.0 |
| c3478b1a-Breast glandular cells | c3478b1a | Breast glandular cells | 44.0 | 8831.0 |
| 1accc48d-Breast myoepithelial cells | 1accc48d | Breast myoepithelial cells | 139.0 | 23296.0 |
| 55d07bd6-Breast myoepithelial cells | 55d07bd6 | Breast myoepithelial cells | 137.0 | 31513.0 |
| c3478b1a-Breast myoepithelial cells | c3478b1a | Breast myoepithelial cells | 194.0 | 44686.0 |
| cd61d9fc-Breast myoepithelial cells | cd61d9fc | Breast myoepithelial cells | 213.0 | 30971.0 |
| 1accc48d-Endothelial cells | 1accc48d | Endothelial cells | 218.0 | 38530.0 |
| 254b31d5-Endothelial cells | 254b31d5 | Endothelial cells | 114.0 | 24778.0 |
| 55d07bd6-Endothelial cells | 55d07bd6 | Endothelial cells | 110.0 | 21927.0 |
| 9f4a2a5c-Endothelial cells | 9f4a2a5c | Endothelial cells | 259.0 | 50526.0 |
| c3478b1a-Endothelial cells | c3478b1a | Endothelial cells | 97.0 | 20142.0 |
| cd61d9fc-Endothelial cells | cd61d9fc | Endothelial cells | 196.0 | 28657.0 |
| 1accc48d-Macrophages | 1accc48d | Macrophages | 459.0 | 84097.0 |
| 254b31d5-Macrophages | 254b31d5 | Macrophages | 147.0 | 37985.0 |
| 55d07bd6-Macrophages | 55d07bd6 | Macrophages | 227.0 | 47766.0 |
| 9f4a2a5c-Macrophages | 9f4a2a5c | Macrophages | 294.0 | 63282.0 |
| c3478b1a-Macrophages | c3478b1a | Macrophages | 433.0 | 81052.0 |
| cd61d9fc-Macrophages | cd61d9fc | Macrophages | 470.0 | 56903.0 |
| 1accc48d-Smooth muscle cells | 1accc48d | Smooth muscle cells | 81.0 | 12949.0 |
| 254b31d5-Smooth muscle cells | 254b31d5 | Smooth muscle cells | 38.0 | 8119.0 |
| 55d07bd6-Smooth muscle cells | 55d07bd6 | Smooth muscle cells | 43.0 | 7113.0 |
| 9f4a2a5c-Smooth muscle cells | 9f4a2a5c | Smooth muscle cells | 126.0 | 22474.0 |
| c3478b1a-Smooth muscle cells | c3478b1a | Smooth muscle cells | 17.0 | 2409.0 |
| cd61d9fc-Smooth muscle cells | cd61d9fc | Smooth muscle cells | 54.0 | 7097.0 |
| 1accc48d-Stromal cells | 1accc48d | Stromal cells | 633.0 | 146404.0 |
| 254b31d5-Stromal cells | 254b31d5 | Stromal cells | 192.0 | 57752.0 |
| 55d07bd6-Stromal cells | 55d07bd6 | Stromal cells | 330.0 | 92977.0 |
| 9f4a2a5c-Stromal cells | 9f4a2a5c | Stromal cells | 325.0 | 72352.0 |
| c3478b1a-Stromal cells | c3478b1a | Stromal cells | 717.0 | 185561.0 |
| cd61d9fc-Stromal cells | cd61d9fc | Stromal cells | 203.0 | 34000.0 |
| 1accc48d-T cells | 1accc48d | T cells | 252.0 | 34913.0 |
| 254b31d5-T cells | 254b31d5 | T cells | 179.0 | 37429.0 |
| 55d07bd6-T cells | 55d07bd6 | T cells | 284.0 | 50298.0 |
| 9f4a2a5c-T cells | 9f4a2a5c | T cells | 326.0 | 55025.0 |
| c3478b1a-T cells | c3478b1a | T cells | 462.0 | 74505.0 |
| cd61d9fc-T cells | cd61d9fc | T cells | 287.0 | 35276.0 |
psbulk.layers["psbulk_props"]
array([[0.36363636, 0.90909091, 0.72727273, ..., 0.36363636, 1.        ,
        0.45454545],
       [0.16847826, 0.44021739, 0.4673913 , ..., 0.29891304, 0.54347826,
        0.20108696],
       [0.27586207, 0.75862069, 0.72413793, ..., 0.4137931 , 0.72413793,
        0.55172414],
       ...,
       [0.21165644, 0.66257669, 0.66871166, ..., 0.31288344, 0.52760736,
        0.23006135],
       [0.03246753, 0.56926407, 0.65367965, ..., 0.35497835, 0.62554113,
        0.21861472],
       [0.14634146, 0.57839721, 0.56445993, ..., 0.34843206, 0.43554007,
        0.20209059]], shape=(60, 297))
Analyze pseudobulk data#
The resulting pseudobulk AnnData object can be used for subsequent analyses using e.g. packages like decoupler. A tutorial on how to analyze pseudobulk data with decoupler can be found here.
import decoupler as dc
dc.pl.filter_samples(
    adata=psbulk,
    groupby=["cell_type_dc_sub_final"],
    min_cells=10,
    min_counts=1000,
    figsize=(8,6),
)
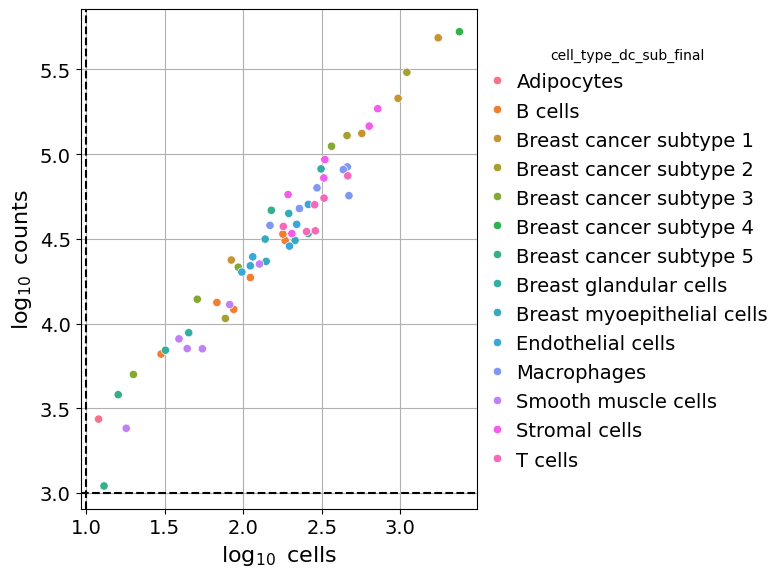
To continue with the analysis one requires more conditions than available in this breast cancer dataset.