Differential gene expression and GO term enrichment analysis#
## The following code ensures that all functions and init files are reloaded before executions.
%load_ext autoreload
%autoreload 2
from pathlib import Path
from insitupy import InSituData, CACHE
import warnings
warnings.simplefilter(action='ignore', category=FutureWarning)
Load Xenium data into InSituData object#
Now the Xenium data can be parsed by providing the data path to the InSituPy project folder.
insitupy_project = Path(CACHE / "out/demo_insitupy_project")
xd = InSituData.read(insitupy_project)
xd.load_images()
xd.load_cells()
xd.load_annotations()
xd
InSituData
Method:		Xenium
Slide ID:	0001879
Sample ID:	Replicate 1
Path:		C:\Users\ge37voy\.cache\InSituPy\out\demo_insitupy_project

    ➤ images
       CD20:	(25778, 35416)
       HE:	(25778, 35416, 3)
       HER2:	(25778, 35416)
       nuclei:	(25778, 35416)
    ➤ cells
       MultiCellData with main layer 'main'
           matrix
               AnnData object with n_obs × n_vars = 156447 × 297
               obs: 'transcript_counts', 'control_probe_counts', 'control_codeword_counts', 'total_counts', 'cell_area', 'nucleus_area', 'n_genes_by_counts', 'n_genes', 'leiden', 'cell_type_dc', 'cell_type_dc_sub', 'cell_type_tacco', 'cell_type_publ_x', 'cell_type_publ_y', 'cell_type_dc_sub_final', 'cell_type_publ'
               var: 'gene_ids', 'feature_types', 'genome', 'n_cells_by_counts', 'mean_counts', 'pct_dropout_by_counts', 'total_counts', 'n_cells'
               uns: 'cell_type_dc_colors', 'cell_type_dc_sub', 'cell_type_dc_sub_colors', 'cell_type_dc_sub_final_colors', 'cell_type_publ_colors', 'cell_type_tacco_colors', 'counts_location', 'leiden', 'leiden_colors', 'log1p', 'neighbors', 'pca', 'umap'
               obsm: 'OT', 'X_pca', 'X_umap', 'annotations', 'ora_estimate', 'ora_pvals', 'regions', 'spatial'
               varm: 'OT', 'PCs'
               layers: 'counts', 'norm_counts'
               obsp: 'connectivities', 'distances'
           boundaries
               BoundariesData object with 2 entries:
                   cells
                   nuclei
    ➤ annotations
       TestKey:	5 annotations, 2 classes ('TestClass', 'test') ✔
       demo:	28 annotations, 2 classes ('Stroma', 'Tumor cells') ✔
       demo2:	5 annotations, 3 classes ('Negative', 'Other', 'Positive') ✔
       demo3:	7 annotations, 5 classes ('Immune cells', 'Necrosis', 'Stroma', 'Tumor', 'unclassified') ✔
       Demo:	28 annotations, 2 classes ('Stroma', 'Tumor cells') ✔
       Janesick:	18 annotations, 3 classes ('DCIS #1', 'DCIS #2', 'Invasive')
       Katja:	18 annotations, 4 classes ('DCIS', 'DCIS intermediate', 'DCIS with stromal reaction', 'Invasive') ✔
Visualize annotations#
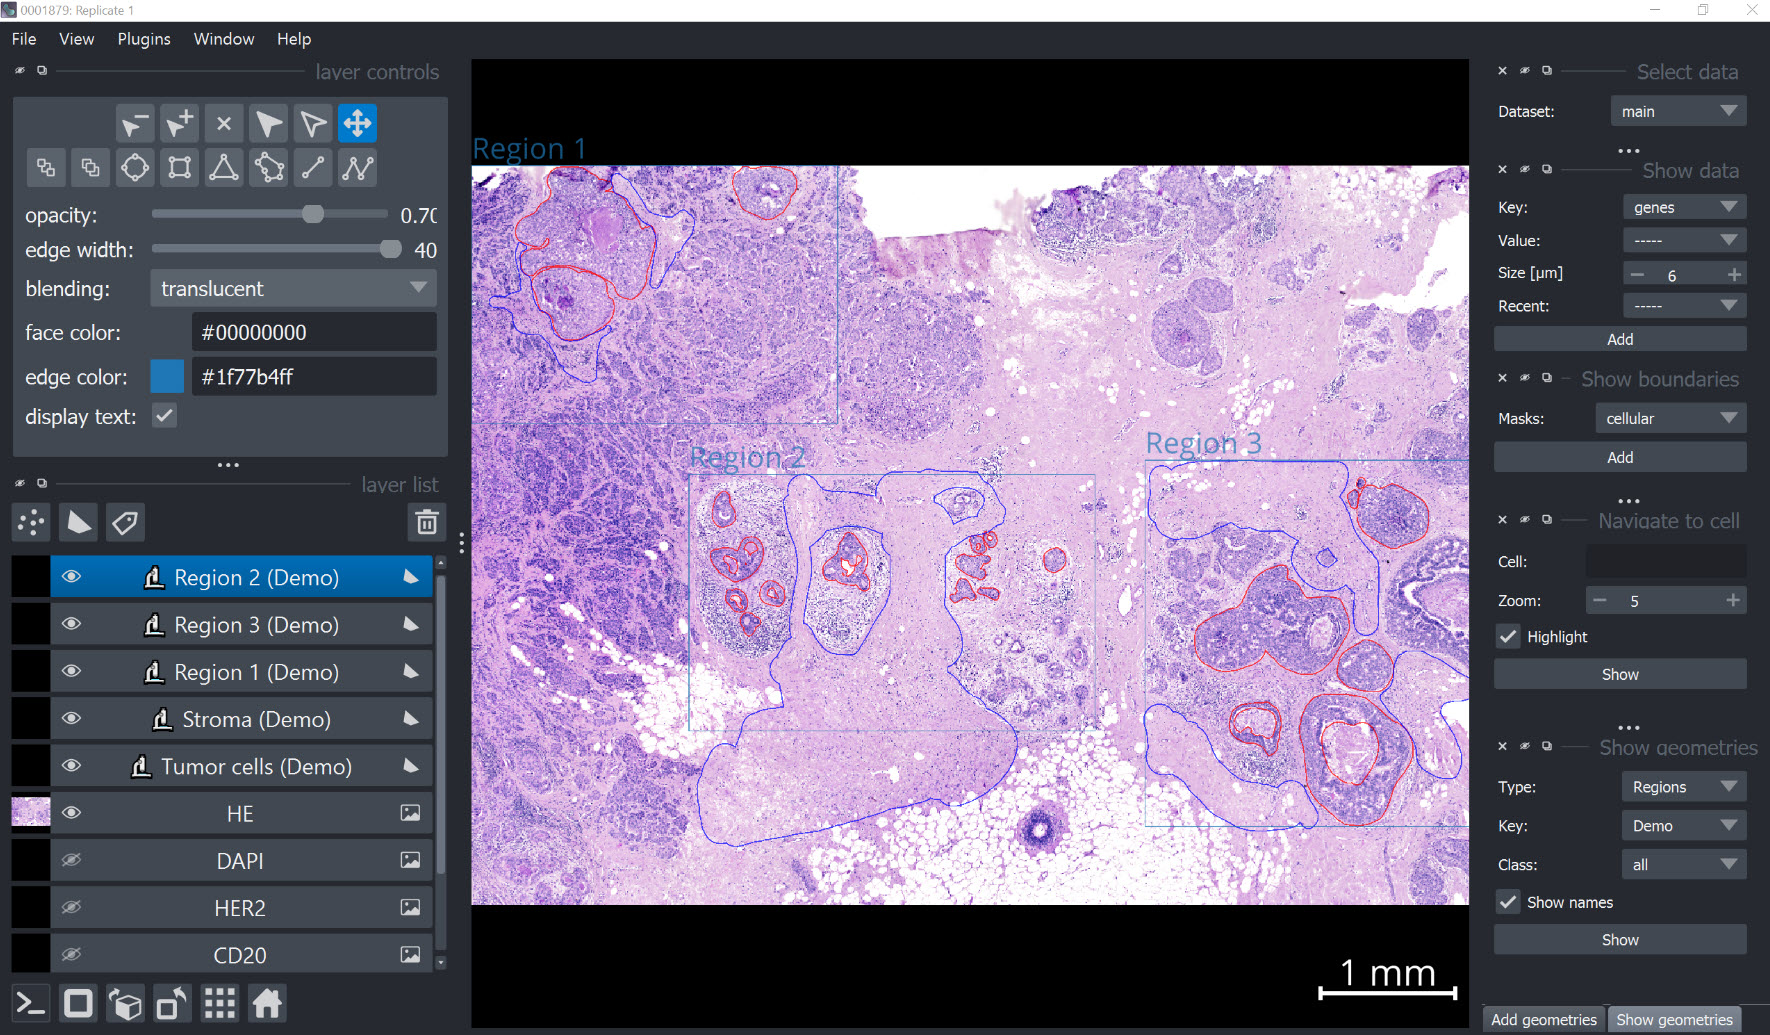
xd.show()
Perform sample-level differential gene expression analysis using InSituData#
from insitupy.tools import differential_gene_expression
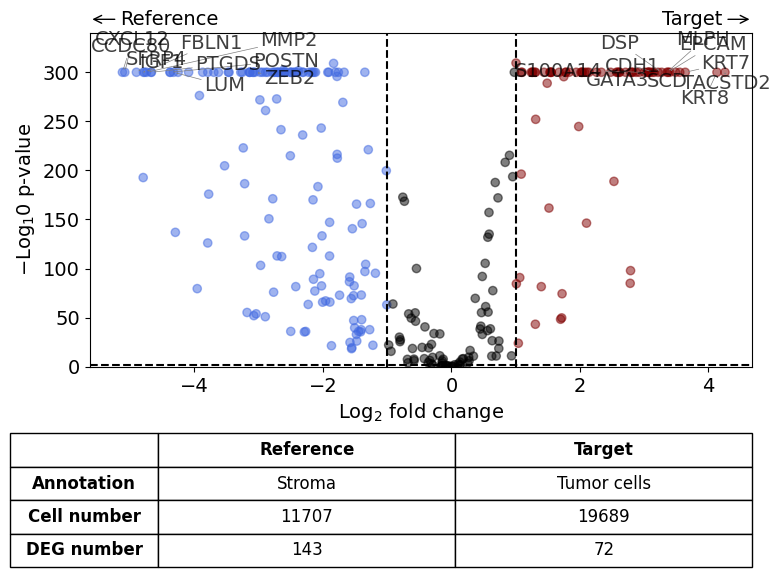
Scenario 1: Comparison of two annotations within one dataset#
differential_gene_expression(
    target=xd,
    target_annotation_tuple=("Demo", "Tumor cells"),
    ref_annotation_tuple=("Demo", "Stroma"),
    ref=None,
    exclude_ambiguous_assignments=True,
    label_top_n=10
)
Exclude ambiguously assigned cells...
Calculate differentially expressed genes with Scanpy's `rank_genes_groups` using 't-test'.
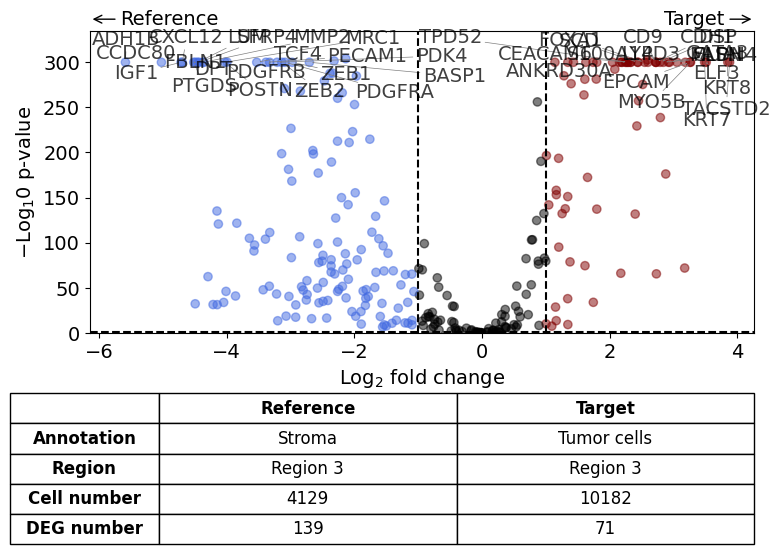
Scenario 2: Comparison of two annotations within one dataset - restrict analysis to a specific region#
differential_gene_expression(
    target=xd,
    target_annotation_tuple=("Demo", "Tumor cells"),
    ref_annotation_tuple=("Demo", "Stroma"),
    ref=None,
    target_region_tuple=("Demo", "Region 3"),
    ref_region_tuple="same",
    exclude_ambiguous_assignments=True, # if a cell is assigned to both the annotation and the reference, it is used only for the annotation
)
Calculate differentially expressed genes with Scanpy's `rank_genes_groups` using 't-test'.
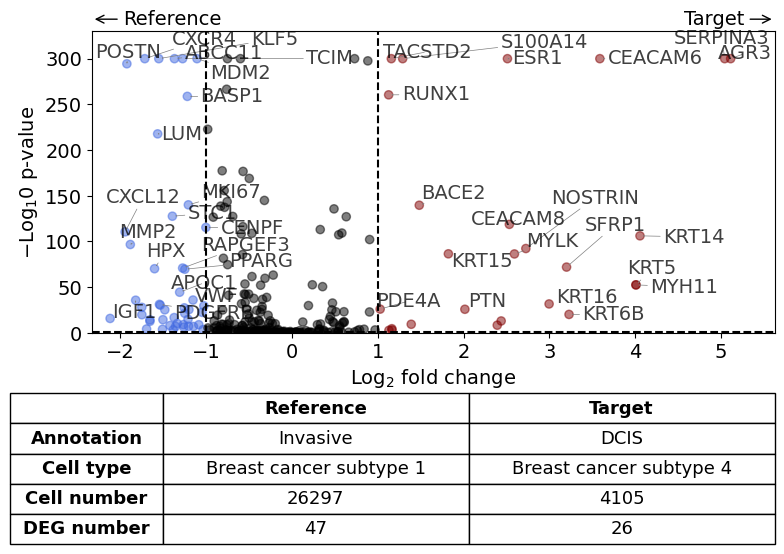
Scenario 3: Comparison of two different cell types each in a different annotation within one dataset#
This is the analysis shown in the publication in Figure 3F.
differential_gene_expression(
    target=xd,
    target_cell_type_tuple=("cell_type_dc_sub_final", "Breast cancer subtype 4"),
    target_annotation_tuple=("Katja", "DCIS"),
    ref_cell_type_tuple=("cell_type_dc_sub_final", "Breast cancer subtype 1"),
    ref_annotation_tuple=("Katja", "Invasive"),
    ref=None,
    exclude_ambiguous_assignments=True, # if a cell is assigned to both the annotation and the reference, it is used only for the annotation
)
Calculate differentially expressed genes with Scanpy's `rank_genes_groups` using 't-test'.
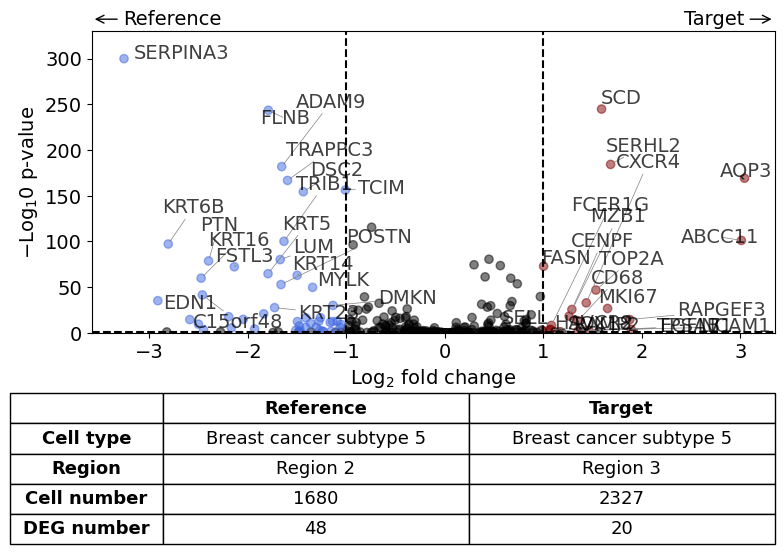
Scenario 4: Comparison of the same cell type in two different regions within one dataset#
This is the analysis shown in the publication in Figure 3H.
xd.load_regions()
xd.regions
demo_regions:	3 regions, 3 classes ('Region1', 'Region2', 'Region3') ✔
TMA:	6 regions, 6 classes ('A-1', 'A-2', 'A-3', 'B-1', 'B-2', 'B-3') ✔
Demo:	3 regions, 3 classes ('Region 1', 'Region 2', 'Region 3') ✔
Katja:	4 regions, 4 classes ('Region 1', 'Region 2', 'Region 3', 'Region 4') ✔
differential_gene_expression(
    target=xd,
    target_cell_type_tuple=("cell_type_dc_sub_final", "Breast cancer subtype 5"),
    target_region_tuple=("Katja", "Region 3"),
    ref_cell_type_tuple="same",
    ref_region_tuple=("Katja", "Region 2"),
    ref=None,
    exclude_ambiguous_assignments=True, # if a cell is assigned to both the annotation and the reference, it is used only for the annotation
)
Calculate differentially expressed genes with Scanpy's `rank_genes_groups` using 't-test'.
Experiment-level differential gene expression analysis#
The clear structure of InSituExperiment lets us easily plan complex differential gene expression analysis across multiple samples. In the following, different Scenarios are shown how this can be done.
For more information on the InSituExperiment object see here.
Creating InSituExperiment object#
In a first step the region annotations are used to split the dataset and create a InSituExperiment object.
from insitupy import InSituExperiment
exp = InSituExperiment.from_regions(
    data=xd,
    region_key="Demo",
    region_names=None # defaults to all regions
)
print(exp)
Region 1
Region 2
Region 3
InSituExperiment with 3 samples:
           uid  CITAR slide_id    sample_id region_key region_name
0     565004e8  ++-++  0001879  Replicate 1       Demo    Region 1
1     237fd8ee  ++-++  0001879  Replicate 1       Demo    Region 2
2     bf57d7ce  ++-++  0001879  Replicate 1       Demo    Region 3
Scenario 1: Comparison of cell types between two samples#
Scenario 1.1: Using the InSituData objects#
First, the datasets of interest are extracted from the InSituExperiment object and subsequently processed using the differential_gene_expression function. In contrast to the previous examples we use now two different datasets.
xd0 = exp.data[0]
xd1 = exp.data[1]
xd2 = exp.data[2]
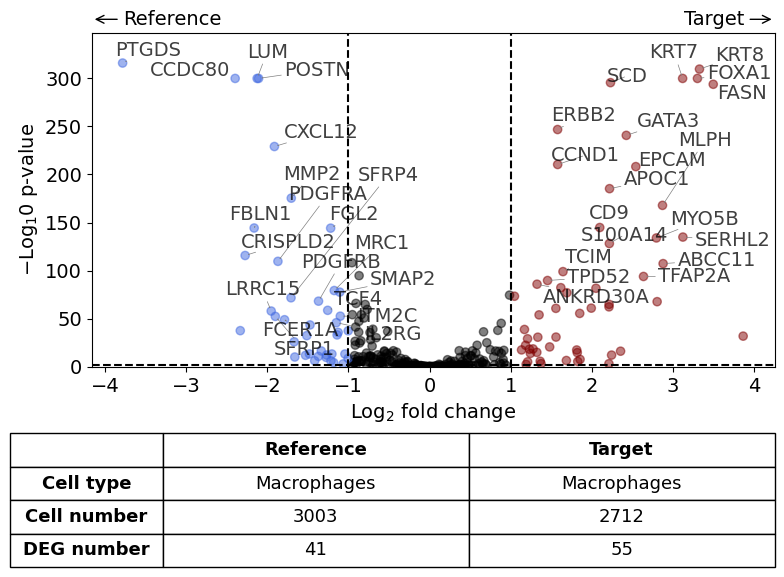
With one reference dataset#
differential_gene_expression(
    target=xd0,
    ref=xd1,
    target_cell_type_tuple=("cell_type_dc_sub_final", "Macrophages"),
    ref_cell_type_tuple="same",
    exclude_ambiguous_assignments=False, # in this case we are sure that there are no duplicate assignments
)
Calculate differentially expressed genes with Scanpy's `rank_genes_groups` using 't-test'.
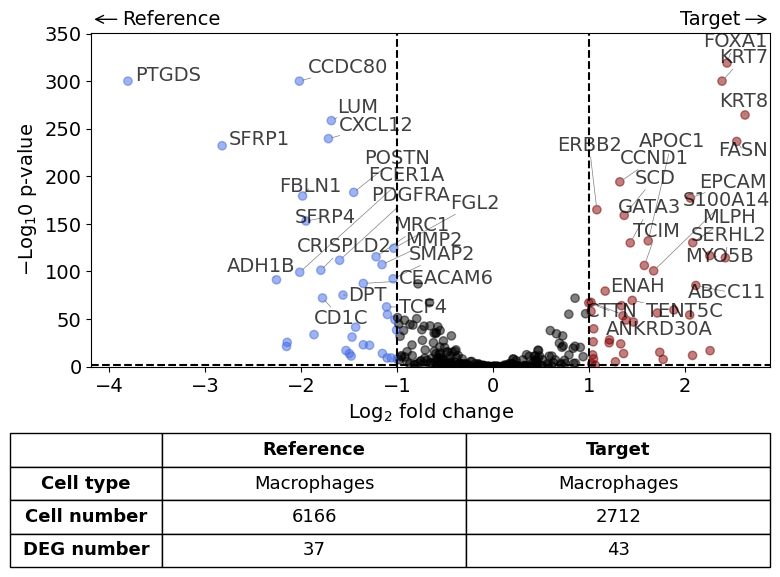
With list of reference datasets#
differential_gene_expression(
    target=xd0,
    ref=[xd1, xd2],
    target_cell_type_tuple=("cell_type_dc_sub_final", "Macrophages"),
    ref_cell_type_tuple="same",
    exclude_ambiguous_assignments=False, # if a cell is assigned to both the annotation and the reference, it is used only for the annotation
)
Calculate differentially expressed genes with Scanpy's `rank_genes_groups` using 't-test'.
Scenario 1.2: Using the InSituExperiment objects#
Instead of extracting the InSituData objects first, we can also perform the DGE analysis directly on the InSituExperiment object using its dge() function.
With one reference dataset#
exp.dge(
    target_id=0,
    ref_id=1,
    target_cell_type_tuple=("cell_type_dc_sub_final", "Macrophages"),
    ref_cell_type_tuple="same",
    exclude_ambiguous_assignments=False,
    name_col="region_name"
)
Calculate differentially expressed genes with Scanpy's `rank_genes_groups` using 't-test'.
With list of reference datasets#
exp.dge(
    target_id=0,
    ref_id=[1,2],
    target_cell_type_tuple=("cell_type_dc_sub_final", "Macrophages"),
    ref_cell_type_tuple="same",
    name_col="region_name"
)
Calculate differentially expressed genes with Scanpy's `rank_genes_groups` using 't-test'.
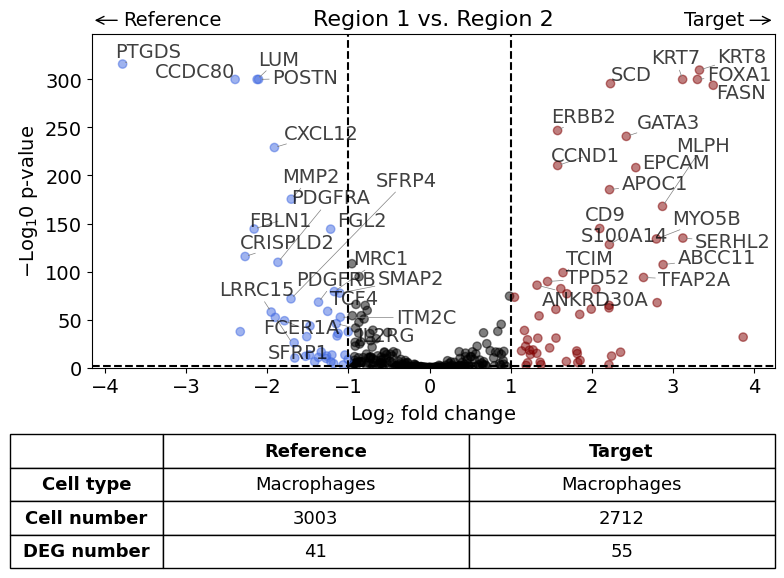
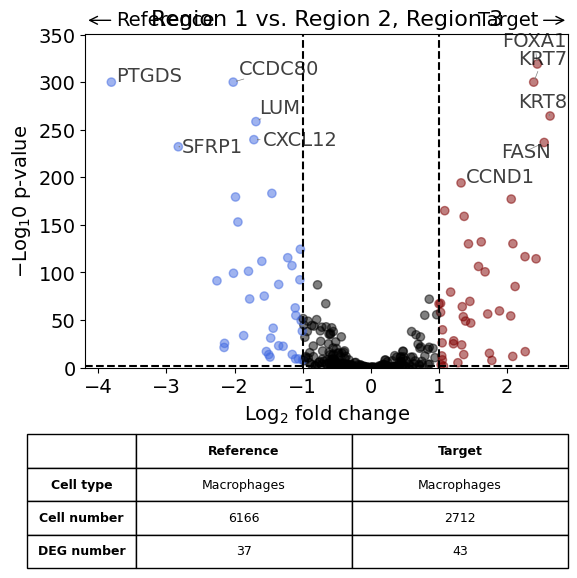
Against all other datasets as reference using "rest" argument#
This should result in the same plot than the previous analysis
exp.dge(
    target_id=0,
    ref_id="rest",
    target_cell_type_tuple=("cell_type_dc_sub_final", "Macrophages"),
    ref_cell_type_tuple="same",
    exclude_ambiguous_assignments=True,
    name_col="region_name",
    figsize=(6,6),
    label_top_n=5,
    savepath="figures/dge_demo_region1_vs_rest.pdf"
)
Calculate differentially expressed genes with Scanpy's `rank_genes_groups` using 't-test'.
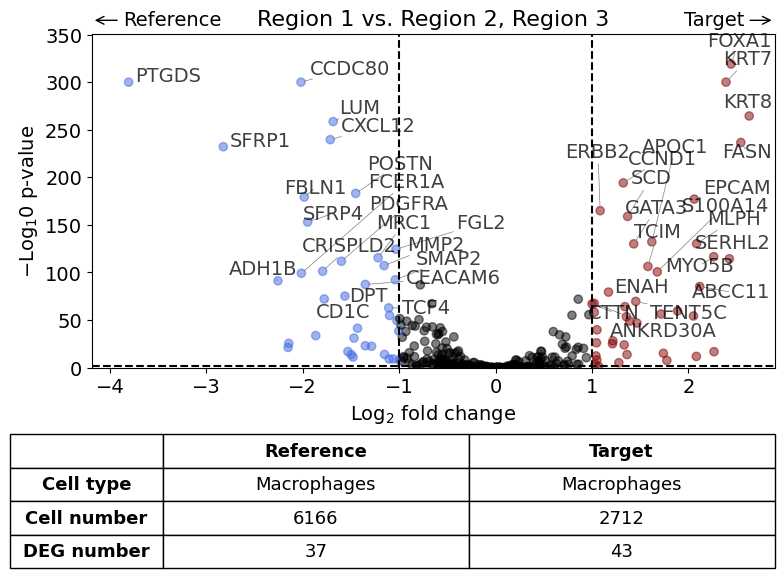
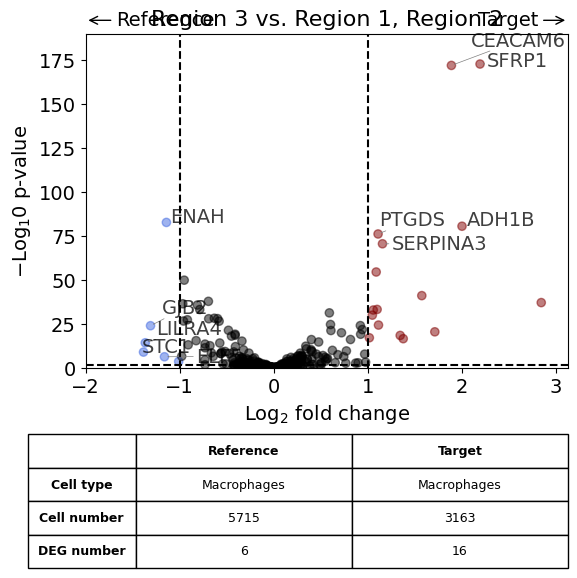
exp.dge(
    target_id=2,
    ref_id="rest",
    target_cell_type_tuple=("cell_type_dc_sub_final", "Macrophages"),
    ref_cell_type_tuple="same",
    exclude_ambiguous_assignments=True,
    name_col="region_name",
    figsize=(6,6),
    label_top_n=5,
    savepath="figures/dge_demo_region3_vs_rest.pdf"
)
Calculate differentially expressed genes with Scanpy's `rank_genes_groups` using 't-test'.
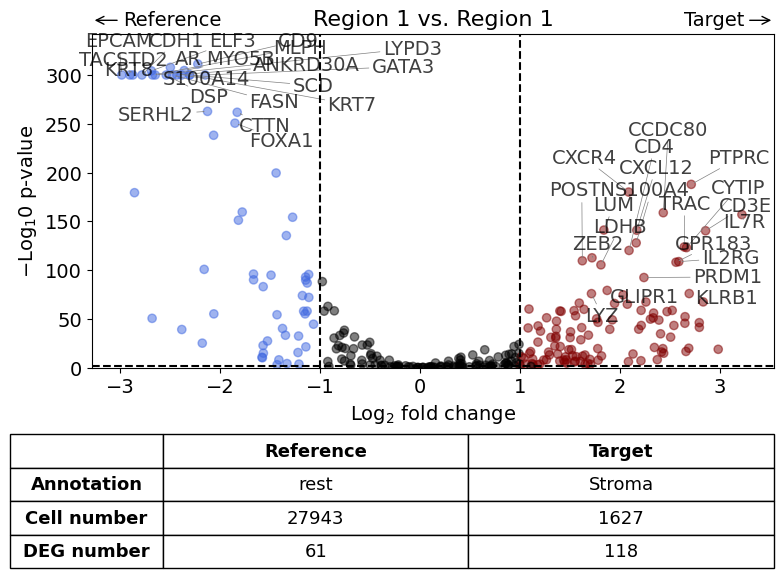
Scenario 2: Comparison of cells within one annotation against all other cells - all within the same dataset#
Scenario 2.1: Perform analysis taking all cell types together#
This scenario is only uses one dataset but also works on the InSituExperiment level. The name_col argument can be used to specify which column of the metadata should be used for generating the title.
exp.dge(
    target_id=0,
    target_annotation_tuple=("Demo", "Stroma"),
    ref_annotation_tuple="rest",
    exclude_ambiguous_assignments=True,
    name_col="region_name",
)
Exclude ambiguously assigned cells...
Calculate differentially expressed genes with Scanpy's `rank_genes_groups` using 't-test'.
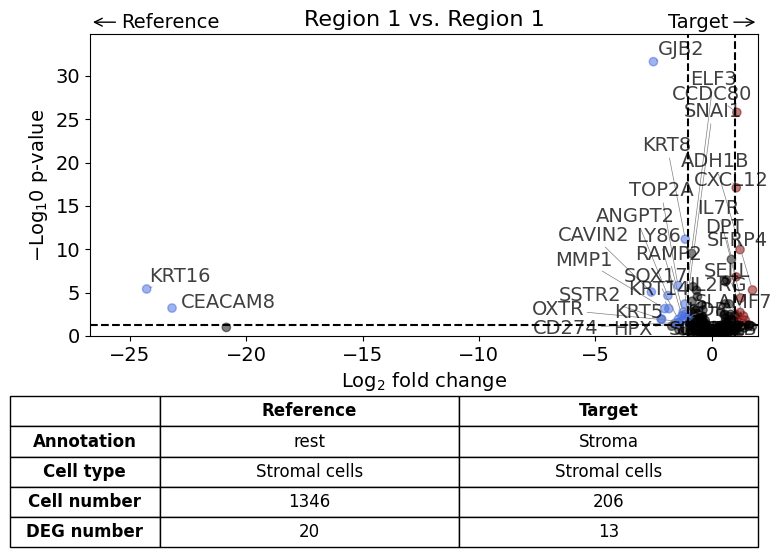
Scenario 2: Comparison of cells within one annotation against all other cells - all within the same dataset but restricted to one cell type#
Scenario 2.1: Perform analysis for one cell type only#
This scenario is very similar to the first but the analysis is restricted to only one cell type (in this case Fibroblasts).
exp.dge(
    target_id=0,
    target_annotation_tuple=("Demo", "Stroma"),
    ref_annotation_tuple="rest",
    target_cell_type_tuple=("cell_type_dc_sub_final", "Stromal cells"),
    ref_cell_type_tuple="same",
    name_col="region_name",
)
Calculate differentially expressed genes with Scanpy's `rank_genes_groups` using 't-test'.
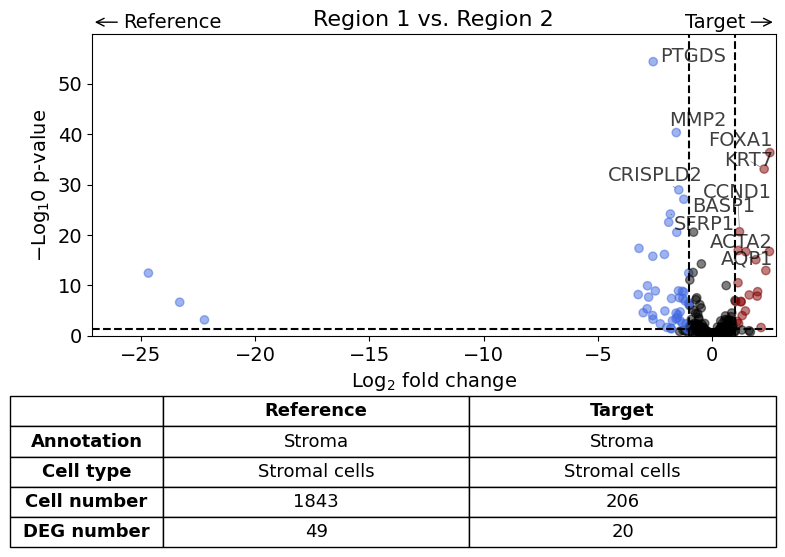
Scenario 3: Comparison of two annotations between two regions or datasets - restrict analysis to one cell type#
Here we compare the gene expression of one particular cell type (fibroblasts) in one histological annotation (Stroma) between two datasets. Further, we save the plot as PDF and restrict the number of labelled genes to 5.
annotation = "Stroma"
cell_type = "Stromal cells"
exp.dge(
    target_id=0,
    ref_id=1,
    target_annotation_tuple=("Demo", annotation),
    ref_annotation_tuple=("Demo", annotation),
    target_cell_type_tuple=("cell_type_dc_sub_final", cell_type),
    ref_cell_type_tuple="same",
    name_col="region_name",
    label_top_n = 5,
    savepath="figures/volcano_demo.pdf"
)
Calculate differentially expressed genes with Scanpy's `rank_genes_groups` using 't-test'.
Scenario 4: Return results instead of Volcano plot#
dge = exp.dge(
    target_id=0,
    ref_id=1,
    target_annotation_tuple=("Demo", annotation),
    ref_annotation_tuple=("Demo", annotation),
    target_cell_type_tuple=("cell_type_dc_sub_final", cell_type),
    return_results=True,
    plot_volcano=False
)
Calculate differentially expressed genes with Scanpy's `rank_genes_groups` using 't-test'.
dge.keys()
dict_keys(['results', 'params'])
dge_results = dge['results']
dge['params']
{'groupby': 'DGE_COMPARISON_COLUMN',
 'reference': 'REFERENCE',
 'method': 't-test',
 'use_raw': False,
 'layer': None,
 'corr_method': 'benjamini-hochberg'}
GO term enrichment analysis#
Gene ontology (GO) term enrichment analysis can be performed via three different analysis platforms: g:Profiler and Enrichr.
As explained here in case of panel-based technologies such as Xenium it is important to us a custom background gene list for the statistical analysis instead of all possible genes. Here, we used the overall gene list for this.
STRINGdb is also implemented but does not allow to limit the background gene list. Therefore, this tool is not recommended to be used for Xenium data.
⚠️ Attention: Due to the low number of genes in a normal Xenium run, using GO term enrichment analysis with such datasets can be problematic. Please get in contact with statisticians to make sure it is ok to use this method with your data.
from insitupy.utils.go import GOEnrichment, get_up_down_genes
from insitupy.plotting.go import go_plot
genes_up, genes_down = get_up_down_genes(
    dge_results, pval_threshold=0.05, logfold_threshold=1)
background_genes = exp.data[0].cells.matrix.var_names.tolist()
# setup go term enrichment class
go = GOEnrichment()

# run go term enrichment analysis for up-regulated genes
go.gprofiler(target_genes=genes_up, key_added='up',
             top_n=20, organism="hsapiens", return_df=False,
             background=background_genes
             )
go.enrichr(target_genes=genes_up, key_added='up',
             top_n=20, organism="human", return_df=False,
             background=background_genes
             )

# for down-regulated genes
go.gprofiler(target_genes=genes_down, key_added='down',
             top_n=20, organism="hsapiens", return_df=False,
             background=background_genes
             )
go.enrichr(target_genes=genes_down, key_added='down',
             top_n=20, organism="human", return_df=False,
             background=background_genes
             )
The results are saved in the GOEnrichment class and can be accessed with the respective keys.
go
GOEnrichment analyses performed:
  gprofiler:
    - up
    - down
  enrichr:
    - up
    - down
Gprofiler does not return any significant results.
enrichment = go.results["gprofiler"]["up"]
enrichment.head()
| source | native | name | p_value | significant | description | term_size | query_size | intersection_size | effective_domain_size | precision | Gene ratio | query | parents | intersections | evidences | Enrichment score |
|---|
enrichment = go.results["gprofiler"]["down"]
enrichment.head()
| source | native | name | p_value | significant | description | term_size | query_size | intersection_size | effective_domain_size | precision | Gene ratio | query | parents | intersections | evidences | Enrichment score |
|---|
Enrichr does return significant results (before multiple testing correction).
enrichment = go.results["enrichr"]["down"]
enrichment.head()
| source | name | P-value | Adjusted P-value | Old P-value | Old adjusted P-value | Odds Ratio | Combined Score | intersections | Enrichment score | native | ||
|---|---|---|---|---|---|---|---|---|---|---|---|---|
| query | 0 | GO_Biological_Process_2025 | Negative Regulation of Signaling | 0.004322 | 0.308539 | 0 | 0 | inf | inf | [ADIPOQ, LIF] | 0.51069 | GO:0023057 |
| 1 | GO_Biological_Process_2025 | Negative Regulation of Cell Communication | 0.004322 | 0.308539 | 0 | 0 | inf | inf | [ADIPOQ, LIF] | 0.51069 | GO:0010648 | |
| 2 | GO_Biological_Process_2025 | Fc Receptor Signaling Pathway | 0.038175 | 0.308539 | 0 | 0 | 10.148148 | 33.139449 | [PIGR, LILRA4] | 0.51069 | GO:0038093 | |
| 3 | GO_Biological_Process_2025 | Positive Regulation of Cold-Induced Thermogenesis | 0.038175 | 0.308539 | 0 | 0 | 10.148148 | 33.139449 | [OXTR, ADIPOQ] | 0.51069 | GO:0120162 | |
| 4 | GO_Biological_Process_2025 | Cytokine-Mediated Signaling Pathway | 0.048466 | 0.308539 | 0 | 0 | 4.711765 | 14.262026 | [CCL8, ADIPOQ, LILRA4] | 0.51069 | GO:0019221 |
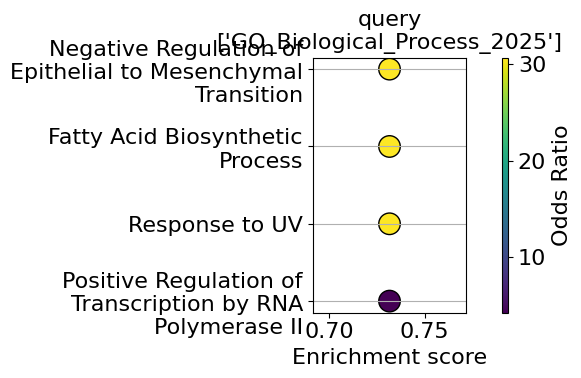
enrichment = go.results["enrichr"]["up"]
enrichment.head()
| source | name | P-value | Adjusted P-value | Old P-value | Old adjusted P-value | Odds Ratio | Combined Score | intersections | Enrichment score | native | ||
|---|---|---|---|---|---|---|---|---|---|---|---|---|
| query | 101 | GO_Biological_Process_2025 | Negative Regulation of Cell-Cell Adhesion Medi... | 0.06734 | 0.185515 | 0 | 0 | inf | inf | [EPCAM] | 0.731622 | GO:2000048 |
| 100 | GO_Biological_Process_2025 | Negative Regulation of Cell-Cell Adhesion | 0.06734 | 0.185515 | 0 | 0 | inf | inf | [EPCAM] | 0.731622 | GO:0022408 | |
| 99 | GO_Biological_Process_2025 | Leukotriene Transport | 0.06734 | 0.185515 | 0 | 0 | inf | inf | [ABCC11] | 0.731622 | GO:0071716 | |
| 98 | GO_Biological_Process_2025 | Norepinephrine Metabolic Process | 0.06734 | 0.185515 | 0 | 0 | inf | inf | [GATA3] | 0.731622 | GO:0042415 | |
| 97 | GO_Biological_Process_2025 | Negative Regulation of Cell Cycle | 0.06734 | 0.185515 | 0 | 0 | inf | inf | [GATA3] | 0.731622 | GO:0045786 |
go_plot(enrichment=enrichment,
        style='dot',
        libraries='GO_Biological_Process_2025',
        color_key="Odds Ratio",
        max_to_plot=5,
        figsize=(6,4),
        #savepath="figures/go_demo.pdf"
        )
GO term enrichment analysis for all three regions#
up_list = []
down_list = []
for i in range(len(exp)):
    dge = exp.dge(
        target_id=i,
        ref_id="rest",
        target_cell_type_tuple=("cell_type_dc_sub", "Macrophages"),
        plot_volcano=False,
        return_results=True
    )
    genes_up, genes_down = get_up_down_genes(dge['results'], pval_threshold=0.05, logfold_threshold=1)
    up_list.append(genes_up)
    down_list.append(genes_down)
Calculate differentially expressed genes with Scanpy's `rank_genes_groups` using 't-test'.
Calculate differentially expressed genes with Scanpy's `rank_genes_groups` using 't-test'.
Calculate differentially expressed genes with Scanpy's `rank_genes_groups` using 't-test'.
up_list
[['KRT7',
  'FOXA1',
  'KRT8',
  'FASN',
  'CCND1',
  'EPCAM',
  'ERBB2',
  'SCD',
  'MLPH',
  'APOC1',
  'GATA3',
  'MYO5B',
  'SERHL2',
  'TCIM',
  'S100A14',
  'ABCC11',
  'ENAH',
  'TENT5C',
  'ANKRD30A',
  'CTTN',
  'SH3YL1',
  'AR',
  'CD9',
  'TRAF4',
  'ELF3',
  'DSP',
  'TFAP2A',
  'PCLAF',
  'CDH1',
  'TOP2A',
  'KLF5',
  'OCIAD2',
  'CENPF',
  'STC1',
  'DMKN',
  'C6orf132',
  'TUBB2B',
  'ELF5',
  'LILRA4',
  'ESM1',
  'SOX17',
  'HPX',
  'SCGB2A1'],
 ['POSTN',
  'LUM',
  'CCDC80',
  'MMP2',
  'CXCL12',
  'CRISPLD2',
  'PDGFRB',
  'PDGFRA',
  'LRRC15',
  'MEDAG',
  'GJB2',
  'GZMB',
  'TCEAL7',
  'LTB'],
 ['SFRP1',
  'CEACAM6',
  'ADH1B',
  'PTGDS',
  'SERPINA3',
  'SFRP4',
  'KRT15',
  'OPRPN',
  'AQP1',
  'FCER1A',
  'CD1C',
  'LPL',
  'KRT23',
  'MMP12',
  'KRT14',
  'MYH11']]
# setup go term enrichment class
go = GOEnrichment()

for i, genes_up in enumerate(up_list):
    # run go term enrichment analysis for up-regulated genes
    go.enrichr(target_genes=genes_up, key_added=f'Region{i+1}_up',
                top_n=20, organism="Human", return_df=False,
                background=background_genes
                )
The results are saved in the GOEnrichment class and can be accessed with the respective keys.
go
GOEnrichment analyses performed:
  enrichr:
    - Region1_up
    - Region2_up
    - Region3_up
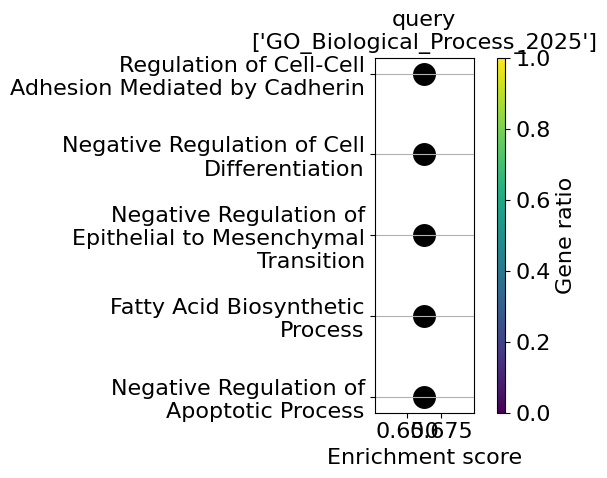
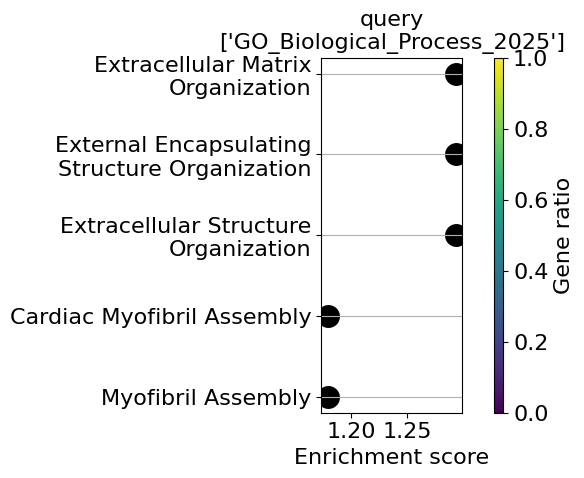
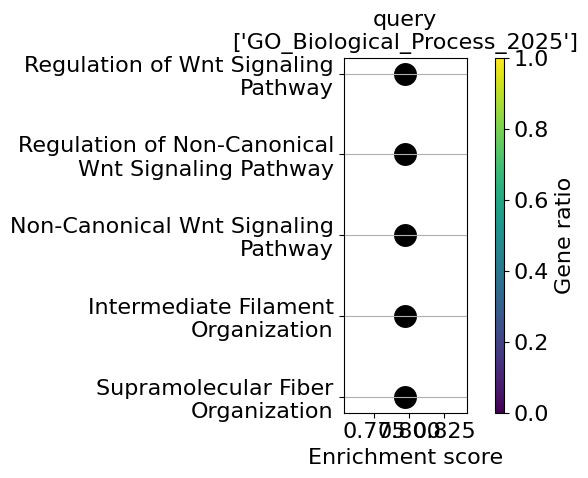
go_results = go.results["enrichr"]

for i, k in enumerate(go_results.keys()):
    enrichment = go_results[k]
    go_plot(enrichment=enrichment,
            style='dot',
            libraries='GO_Biological_Process_2025',
            max_to_plot=5,
            figsize=(6,5),
            #savepath=f"figures/go_demo_region{i+1}.pdf"
            )
color_key 'Gene ratio' not found in columns.
color_key 'Gene ratio' not found in columns.
color_key 'Gene ratio' not found in columns.