Differential gene expression and GO term enrichment analysis#
from pathlib import Path
from insitupy import InSituData, CACHE
import warnings
warnings.simplefilter(action='ignore', category=FutureWarning)
Load Xenium data into InSituData object#
Now the Xenium data can be parsed by providing the data path to the InSituPy project folder.
insitupy_project = Path(CACHE / "out/demo_insitupy_project")
xd = InSituData.read(insitupy_project)
xd.load_images()
xd.load_cells()
xd
InSituData
Method:		Xenium
Slide ID:	0001879
Sample ID:	Replicate 1
Path:		C:\Users\ge37voy\.cache\InSituPy\out\demo_insitupy_project
Metadata file:	.ispy
    ➤ images
       nuclei:	(25778, 35416)
       CD20:	(25778, 35416)
       HER2:	(25778, 35416)
       HE:	(25778, 35416, 3)
    ➤ cells
       matrix
           AnnData object with n_obs × n_vars = 156447 × 297
           obs: 'transcript_counts', 'control_probe_counts', 'control_codeword_counts', 'total_counts', 'cell_area', 'nucleus_area', 'n_genes_by_counts', 'n_genes', 'leiden', 'cell_type_dc', 'cell_type_tacco', 'cell_type_dc_sub', 'cell_type_publ'
           var: 'gene_ids', 'feature_types', 'genome', 'n_cells_by_counts', 'mean_counts', 'pct_dropout_by_counts', 'total_counts', 'n_cells'
           uns: 'cell_type_dc_colors', 'cell_type_dc_sub', 'cell_type_dc_sub_colors', 'cell_type_publ_colors', 'cell_type_tacco_colors', 'counts_location', 'leiden', 'leiden_colors', 'log1p', 'neighbors', 'pca', 'umap'
           obsm: 'OT', 'X_pca', 'X_umap', 'annotations', 'ora_estimate', 'ora_pvals', 'regions', 'spatial'
           varm: 'OT', 'PCs'
           layers: 'counts', 'norm_counts'
           obsp: 'connectivities', 'distances'
       boundaries
           BoundariesData object with 2 entries:
               cells
               nuclei
xd.import_annotations(
    files="./demo_annotations/demo_annotations.geojson",
    keys="Demo",
    scale_factor=0.2125
)
xd.import_regions(
    files="./demo_regions/demo_regions.geojson",
    keys="Demo",
    scale_factor=0.2125
)
Visualize annotations#
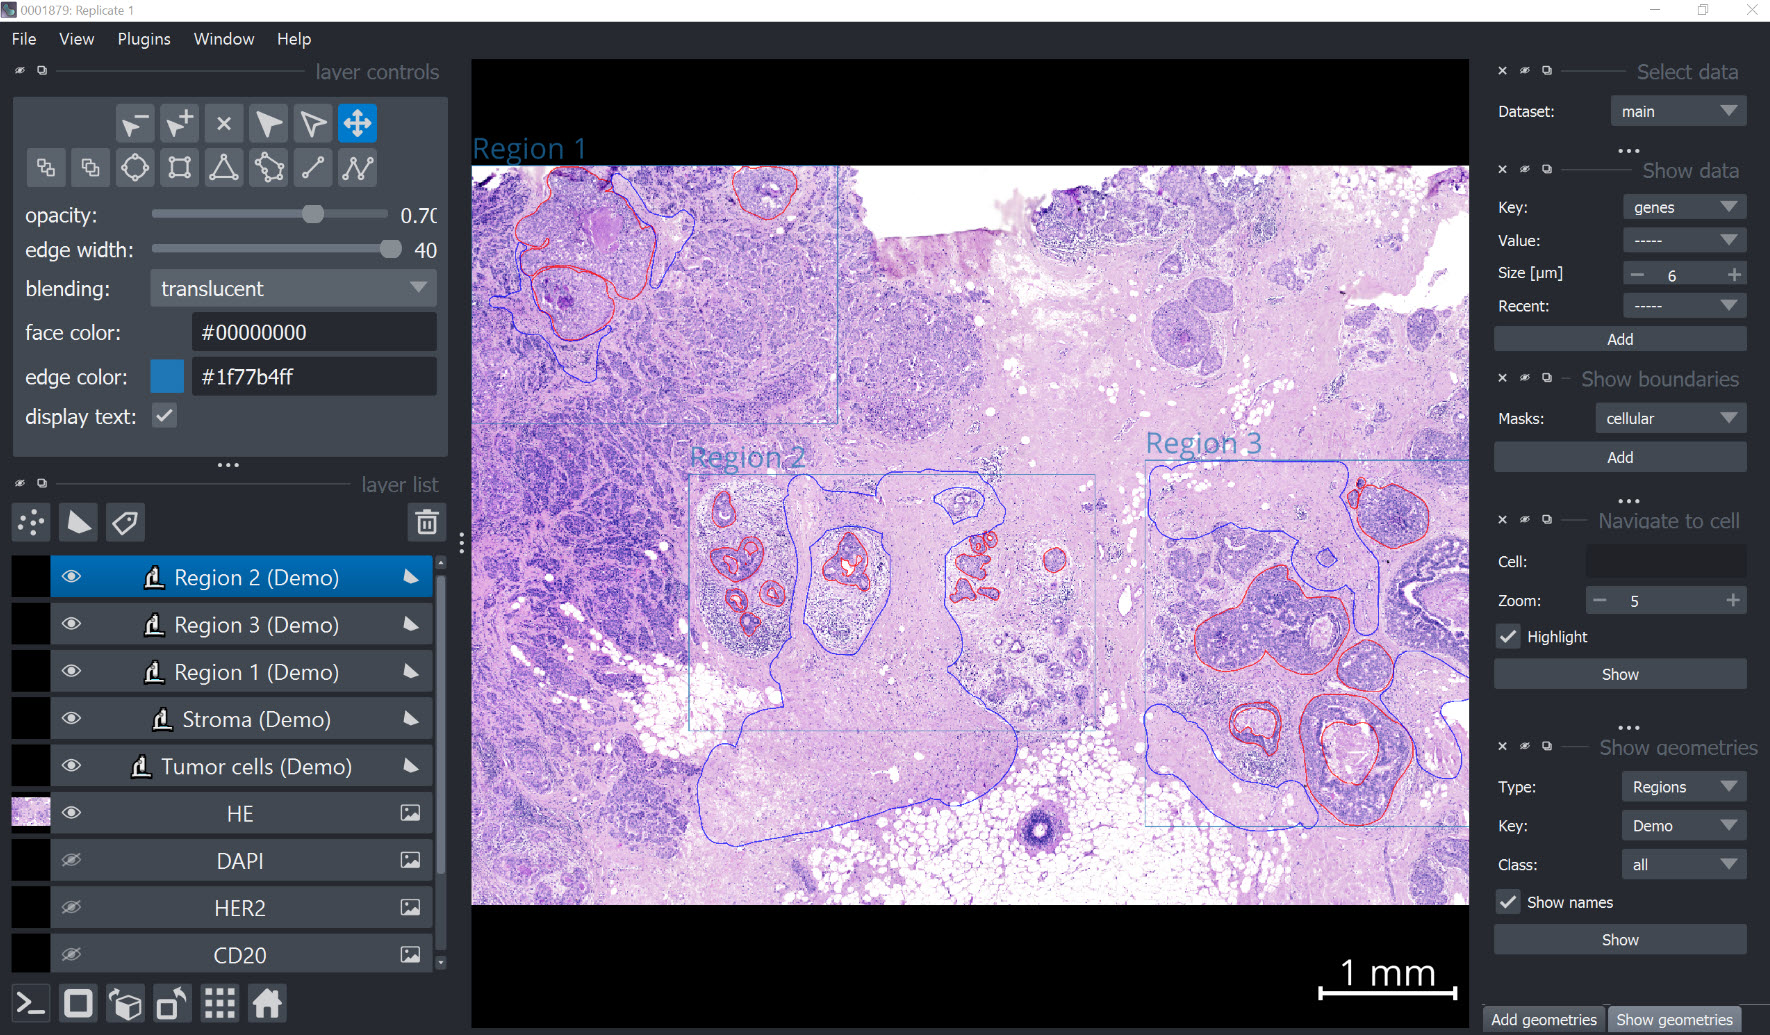
xd.show()
Perform sample-level differential gene expression analysis using InSituData#
from insitupy import differential_gene_expression
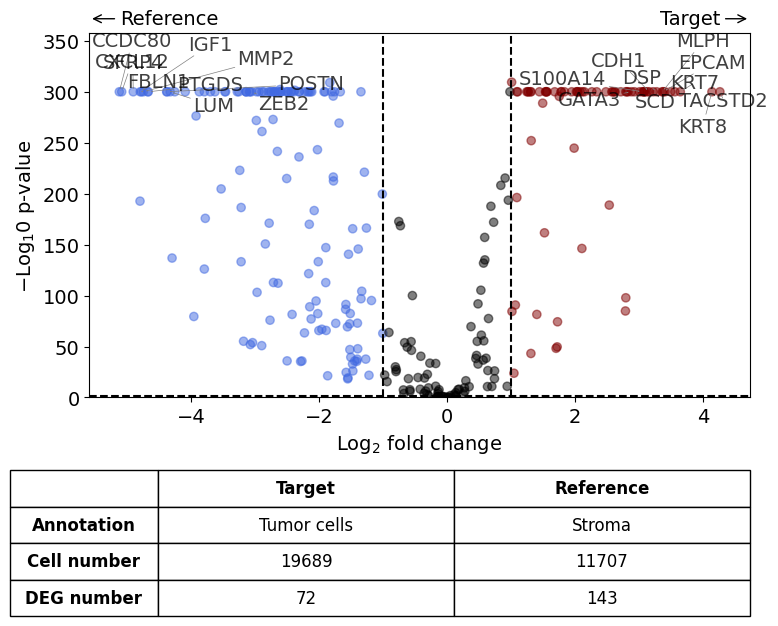
Scenario 1: Comparison of two annotations within one dataset#
differential_gene_expression(
    target=xd,
    target_annotation_tuple=("Demo", "Tumor cells"),
    ref_annotation_tuple=("Demo", "Stroma"),
    ref=None,
    exclude_ambiguous_assignments=True,
    label_top_n=10
)
Exclude ambiguously assigned cells...
Calculate differentially expressed genes with Scanpy's `rank_genes_groups` using 't-test'.
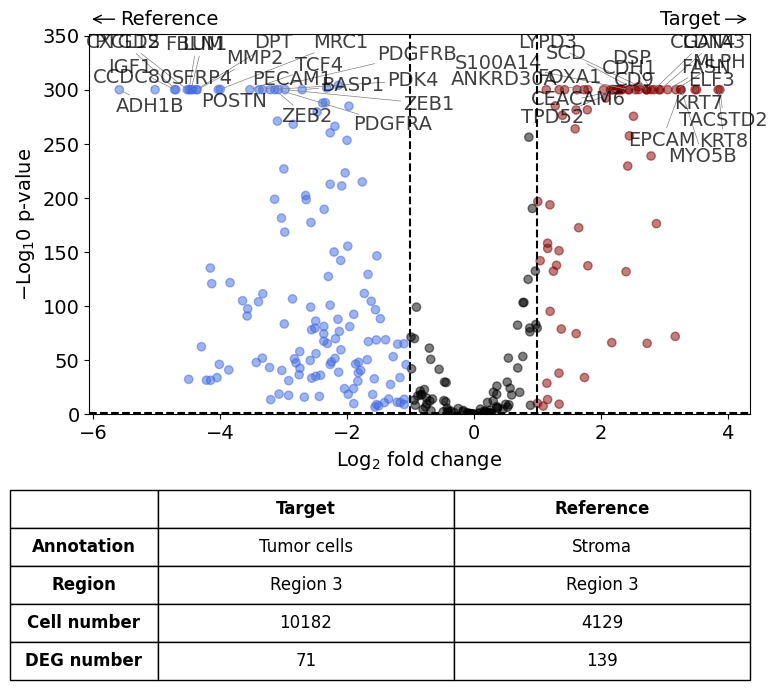
Scenario 2: Comparison of two annotations within one dataset - restrict analysis to a specific region#
xd
InSituData
Method:		Xenium
Slide ID:	0001879
Sample ID:	Replicate 1
Path:		C:\Users\ge37voy\.cache\InSituPy\out\demo_insitupy_project
Metadata file:	.ispy
    ➤ images
       nuclei:	(25778, 35416)
       CD20:	(25778, 35416)
       HER2:	(25778, 35416)
       HE:	(25778, 35416, 3)
    ➤ cells
       matrix
           AnnData object with n_obs × n_vars = 156447 × 297
           obs: 'transcript_counts', 'control_probe_counts', 'control_codeword_counts', 'total_counts', 'cell_area', 'nucleus_area', 'n_genes_by_counts', 'n_genes', 'leiden', 'cell_type_dc', 'cell_type_tacco', 'cell_type_dc_sub', 'cell_type_publ'
           var: 'gene_ids', 'feature_types', 'genome', 'n_cells_by_counts', 'mean_counts', 'pct_dropout_by_counts', 'total_counts', 'n_cells'
           uns: 'cell_type_dc_colors', 'cell_type_dc_sub', 'cell_type_dc_sub_colors', 'cell_type_publ_colors', 'cell_type_tacco_colors', 'counts_location', 'leiden', 'leiden_colors', 'log1p', 'neighbors', 'pca', 'umap'
           obsm: 'OT', 'X_pca', 'X_umap', 'annotations', 'ora_estimate', 'ora_pvals', 'regions', 'spatial'
           varm: 'OT', 'PCs'
           layers: 'counts', 'norm_counts'
           obsp: 'connectivities', 'distances'
       boundaries
           BoundariesData object with 2 entries:
               cells
               nuclei
    ➤ annotations
       Demo:	28 annotations, 2 classes ('Tumor cells','Stroma')
    ➤ regions
       Demo:	3 regions, 3 classes ('Region 1','Region 3','Region 2')
differential_gene_expression(
    target=xd,
    target_annotation_tuple=("Demo", "Tumor cells"),
    ref_annotation_tuple=("Demo", "Stroma"),
    ref=None,
    target_region_tuple=("Demo", "Region 3"),
    ref_region_tuple="same",
    exclude_ambiguous_assignments=True, # if a cell is assigned to both the annotation and the reference, it is used only for the annotation
)
Calculate differentially expressed genes with Scanpy's `rank_genes_groups` using 't-test'.
Experiment-level differential gene expression analysis#
The clear structure of InSituExperiment lets us easily plan complex differential gene expression analysis across multiple samples. In the following, different Scenarios are shown how this can be done.
For more information on the InSituExperiment object see here.
Creating InSituExperiment object#
In a first step the region annotations are used to split the dataset and create a InSituExperiment object.
from insitupy import InSituExperiment
exp = InSituExperiment.from_regions(
    data=xd,
    region_key="Demo",
    region_names=None # defaults to all regions
)
exp
InSituExperiment with 3 samples:
           uid slide_id    sample_id region_key region_name
0     6476570c  0001879  Replicate 1       Demo    Region 1
1     b674bdde  0001879  Replicate 1       Demo    Region 2
2     f81c90d3  0001879  Replicate 1       Demo    Region 3
Scenario 1: Comparison of cell types between two samples#
Scenario 1.1: Using the InSituData objects#
First, the datasets of interest are extracted from the InSituExperiment object and subsequently processed using the differential_gene_expression function. In contrast to the previous examples we use now two different datasets.
xd0 = exp.data[0]
xd1 = exp.data[1]
xd2 = exp.data[2]
exp
InSituExperiment with 3 samples:
           uid slide_id    sample_id region_key region_name
0     6476570c  0001879  Replicate 1       Demo    Region 1
1     b674bdde  0001879  Replicate 1       Demo    Region 2
2     f81c90d3  0001879  Replicate 1       Demo    Region 3
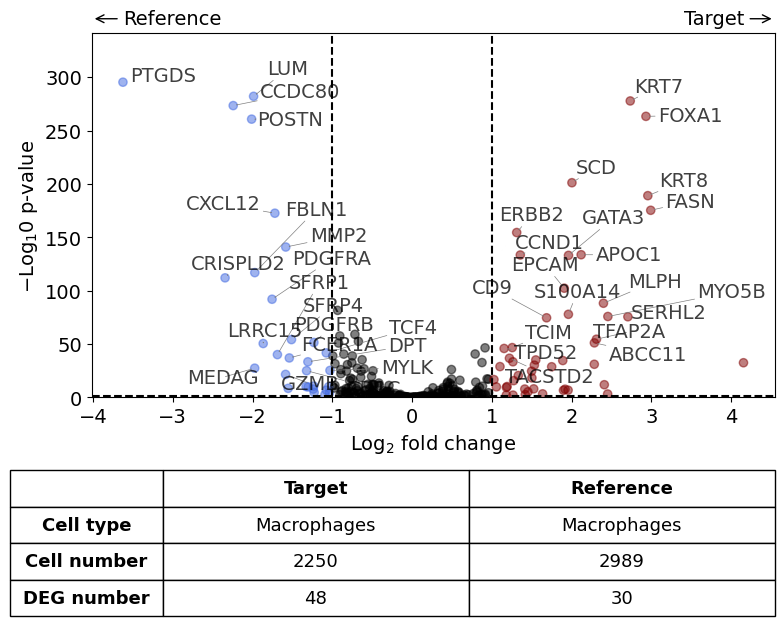
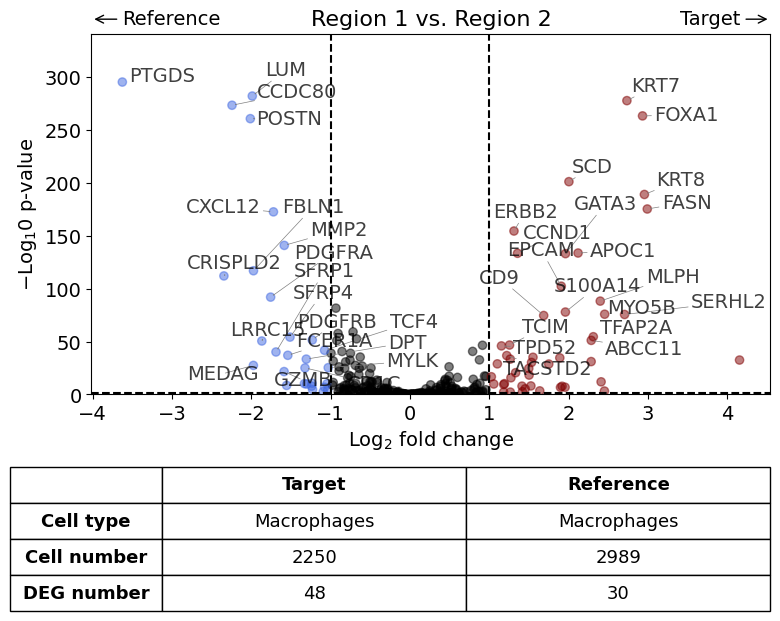
With one reference dataset#
differential_gene_expression(
    target=xd0,
    ref=xd1,
    target_cell_type_tuple=("cell_type_dc_sub", "Macrophages"),
    ref_cell_type_tuple="same",
    exclude_ambiguous_assignments=False, # in this case we are sure that there
)
Calculate differentially expressed genes with Scanpy's `rank_genes_groups` using 't-test'.
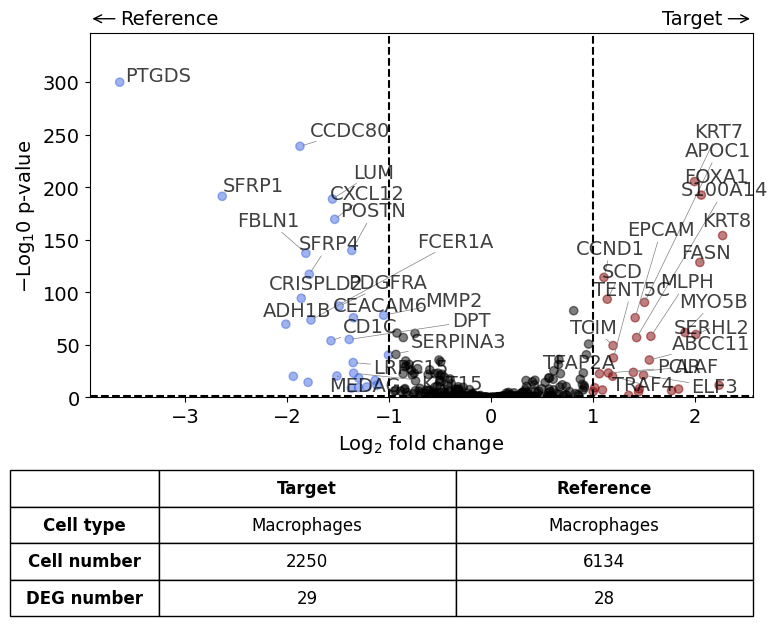
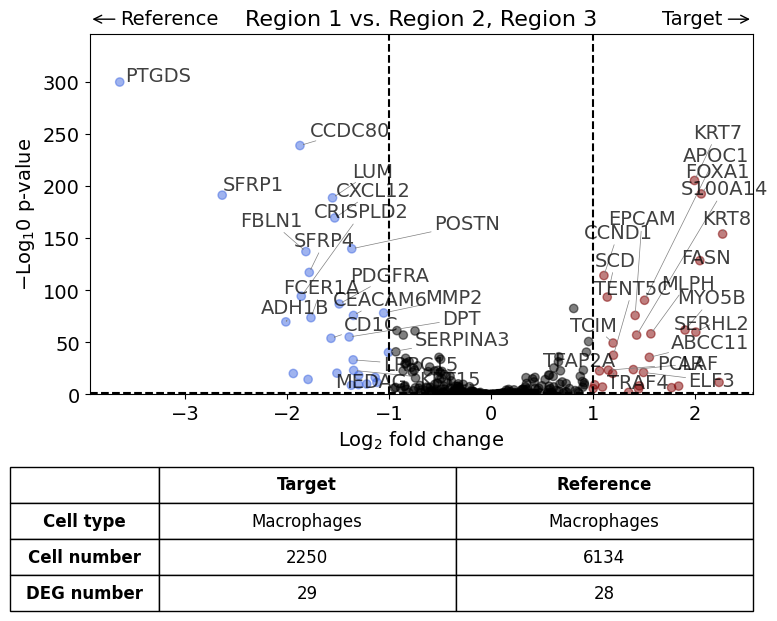
With list of reference datasets#
differential_gene_expression(
    target=xd0,
    ref=[xd1, xd2],
    target_cell_type_tuple=("cell_type_dc_sub", "Macrophages"),
    ref_cell_type_tuple="same",
    exclude_ambiguous_assignments=False, # if a cell is assigned to both the annotation and the reference, it is used only for the annotation
)
Calculate differentially expressed genes with Scanpy's `rank_genes_groups` using 't-test'.
Scenario 1.2: Using the InSituExperiment objects#
Instead of extracting the InSituData objects first, we can also perform the DGE analysis directly on the InSituExperiment object using its dge() function.
With one reference dataset#
exp.dge(
    target_id=0,
    ref_id=1,
    target_cell_type_tuple=("cell_type_dc_sub", "Macrophages"),
    ref_cell_type_tuple="same",
    exclude_ambiguous_assignments=False,
    name_col="region_name"
)
Calculate differentially expressed genes with Scanpy's `rank_genes_groups` using 't-test'.
With list of reference datasets#
exp.dge(
    target_id=0,
    ref_id=[1,2],
    target_cell_type_tuple=("cell_type_dc_sub", "Macrophages"),
    ref_cell_type_tuple="same",
    name_col="region_name"
)
Calculate differentially expressed genes with Scanpy's `rank_genes_groups` using 't-test'.
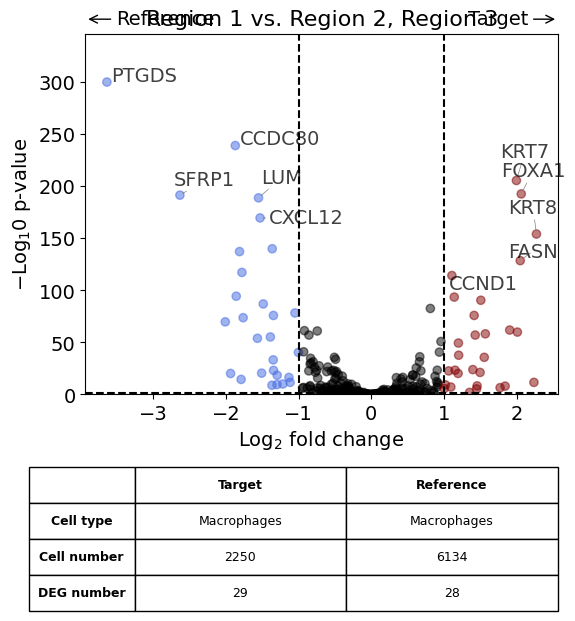
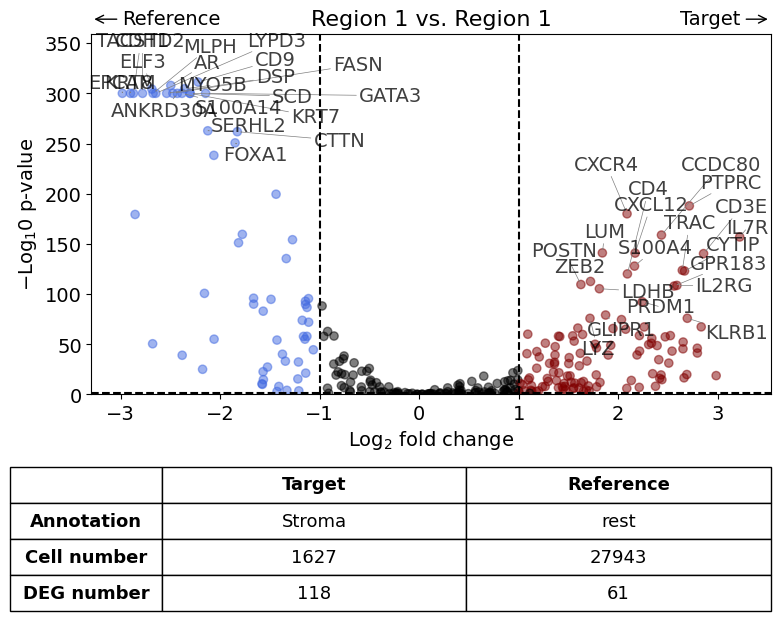
Against all other datasets as reference using "rest" argument#
This should result in the same plot than the previous analysis
exp.dge(
    target_id=0,
    ref_id="rest",
    target_cell_type_tuple=("cell_type_dc_sub", "Macrophages"),
    ref_cell_type_tuple="same",
    exclude_ambiguous_assignments=True,
    name_col="region_name",
    figsize=(6,6),
    label_top_n=5,
    savepath="figures/dge_demo_region1_vs_rest.pdf"
)
Calculate differentially expressed genes with Scanpy's `rank_genes_groups` using 't-test'.
Saving figure to file figures/dge_demo_region1_vs_rest.pdf
Saved.
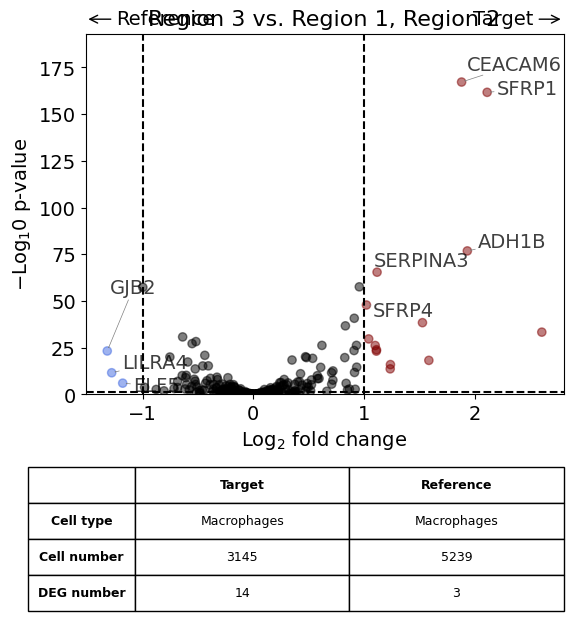
exp.dge(
    target_id=2,
    ref_id="rest",
    target_cell_type_tuple=("cell_type_dc_sub", "Macrophages"),
    ref_cell_type_tuple="same",
    exclude_ambiguous_assignments=True,
    name_col="region_name",
    figsize=(6,6),
    label_top_n=5,
    savepath="figures/dge_demo_region3_vs_rest.pdf"
)
Calculate differentially expressed genes with Scanpy's `rank_genes_groups` using 't-test'.
Saving figure to file figures/dge_demo_region3_vs_rest.pdf
Saved.
Scenario 2: Comparison of cells within one annotation against all other cells - all within the same dataset#
Scenario 2.1: Perform analysis taking all cell types together#
This scenario is only uses one dataset but also works on the InSituExperiment level. The name_col argument can be used to specify which column of the metadata should be used for generating the title.
exp.dge(
    target_id=0,
    target_annotation_tuple=("Demo", "Stroma"),
    ref_annotation_tuple="rest",
    exclude_ambiguous_assignments=True,
    name_col="region_name",
)
Exclude ambiguously assigned cells...
Calculate differentially expressed genes with Scanpy's `rank_genes_groups` using 't-test'.
Scenario 2: Comparison of cells within one annotation against all other cells - all within the same dataset but restricted to one cell type#
Scenario 2.1: Perform analysis for one cell type only#
This scenario is very similar to the first but the analysis is restricted to only one cell type (in this case Fibroblasts).
exp.dge(
    target_id=0,
    target_annotation_tuple=("Demo", "Stroma"),
    ref_annotation_tuple="rest",
    target_cell_type_tuple=("cell_type_dc", "Fibroblasts"),
    ref_cell_type_tuple="same",
    name_col="region_name",
)
Calculate differentially expressed genes with Scanpy's `rank_genes_groups` using 't-test'.
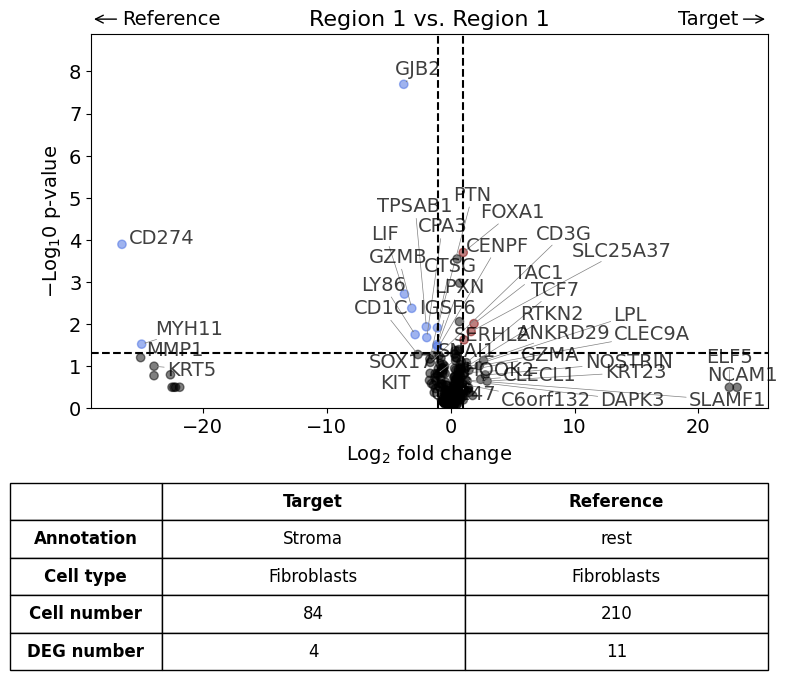
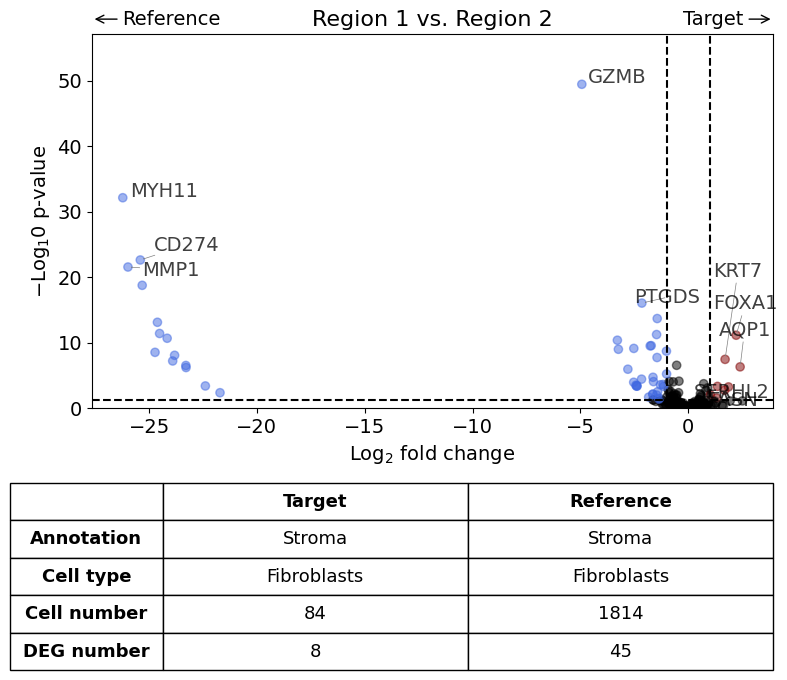
Scenario 3: Comparison of two annotations between two regions or datasets - restrict analysis to one cell type#
Here we compare the gene expression of one particular cell type (fibroblasts) in one histological annotation (Stroma) between two datasets. Further, we save the plot as PDF and restrict the number of labelled genes to 5.
annotation = "Stroma"
cell_type = "Fibroblasts"

exp.dge(
    target_id=0,
    ref_id=1,
    target_annotation_tuple=("Demo", annotation),
    ref_annotation_tuple=("Demo", annotation),
    target_cell_type_tuple=("cell_type_dc", cell_type),
    ref_cell_type_tuple="same",
    name_col="region_name",
    label_top_n = 5,
    savepath="figures/volcano_demo.pdf"
)
Calculate differentially expressed genes with Scanpy's `rank_genes_groups` using 't-test'.
Saving figure to file figures/volcano_demo.pdf
Saved.
Scenario 4: Return results instead of Volcano plot#
dge = exp.dge(
    target_id=0,
    ref_id=1,
    target_annotation_tuple=("Demo", annotation),
    ref_annotation_tuple=("Demo", annotation),
    target_cell_type_tuple=("cell_type_tacco", cell_type),
    return_results=True,
    plot_volcano=False
)
Calculate differentially expressed genes with Scanpy's `rank_genes_groups` using 't-test'.
dge.keys()
dict_keys(['results', 'params'])
dge_results = dge['results']
dge['params']
{'groupby': 'DGE_COMPARISON_COLUMN',
 'reference': 'REFERENCE',
 'method': 't-test',
 'use_raw': False,
 'layer': None,
 'corr_method': 'benjamini-hochberg'}
GO term enrichment analysis#
Gene ontology (GO) term enrichment analysis can be performed via three different analysis platforms: STRINGdb, g:Profiler, and Enrichr.
from insitupy.utils.go import GOEnrichment, get_up_down_genes
from insitupy.plotting.go import go_plot
genes_up, genes_down = get_up_down_genes(dge_results, pval_threshold=0.05, logfold_threshold=1)
# setup go term enrichment class
go = GOEnrichment()

# run go term enrichment analysis for up-regulated genes
go.stringdb(target_genes=genes_up, key_added='up',
             top_n=20, organism="hsapiens", return_df=False
             )
go.gprofiler(target_genes=genes_up, key_added='up',
             top_n=20, organism="hsapiens", return_df=False
             )
go.enrichr(target_genes=genes_up, key_added='up',
             top_n=20, organism="human", return_df=False
             )

# for down-regulated genes
go.stringdb(target_genes=genes_down, key_added='down',
             top_n=20, organism="hsapiens", return_df=False
             )
go.gprofiler(target_genes=genes_down, key_added='down',
             top_n=20, organism="hsapiens", return_df=False
             )
go.enrichr(target_genes=genes_down, key_added='down',
             top_n=20, organism="human", return_df=False
             )
The results are saved in the GOEnrichment class and can be accessed with the respective keys.
go
GOEnrichment analyses performed:
  stringdb:
    - up
    - down
  gprofiler:
    - up
    - down
  enrichr:
    - up
    - down
enrichment = go.results["gprofiler"]["down"]
enrichment.head()
| source | native | name | p_value | significant | description | term_size | query_size | intersection_size | effective_domain_size | precision | Gene ratio | query | parents | intersections | evidences | Enrichment score | ||
|---|---|---|---|---|---|---|---|---|---|---|---|---|---|---|---|---|---|---|
| query | 0 | GO:CC | GO:0062023 | collagen-containing extracellular matrix | 0.000241 | True | "An extracellular matrix consisting mainly of ... | 425 | 20 | 6 | 22115 | 0.3 | 0.014118 | query_1 | [GO:0031012] | [CTSG, EGFL7, NCAM1, TPSAB1, ANGPT2, CPA3] | [[HDA], [HDA], [HDA], [HDA], [IBA], [HDA]] | 3.617671 |
| 1 | GO:CC | GO:0031012 | extracellular matrix | 0.001123 | True | "A structure lying external to one or more cel... | 555 | 20 | 6 | 22115 | 0.3 | 0.010811 | query_1 | [GO:0030312] | [CTSG, EGFL7, NCAM1, TPSAB1, ANGPT2, CPA3] | [[HDA], [HDA], [HDA], [HDA], [IBA], [HDA]] | 2.949698 | |
| 2 | GO:CC | GO:0030312 | external encapsulating structure | 0.001134 | True | "A structure that lies outside the plasma memb... | 556 | 20 | 6 | 22115 | 0.3 | 0.010791 | query_1 | [GO:0071944, GO:0110165] | [CTSG, EGFL7, NCAM1, TPSAB1, ANGPT2, CPA3] | [[HDA], [HDA], [HDA], [HDA], [IBA], [HDA]] | 2.945225 | |
| 3 | GO:CC | GO:0005576 | extracellular region | 0.010306 | True | "The space external to the outermost structure... | 4232 | 20 | 12 | 22115 | 0.6 | 0.002836 | query_1 | [GO:0110165] | [DNAAF1, CTSG, EGFL7, NCAM1, TPSAB1, KRT5, ANG... | [[IEA], [IDA, HDA, TAS, IEA], [ISS, IBA, IEA],... | 1.986905 | |
| 4 | GO:MF | GO:0019763 | immunoglobulin receptor activity | 0.012722 | True | "Combining with the Fc region of an immunoglob... | 10 | 20 | 2 | 20196 | 0.1 | 0.200000 | query_1 | [GO:0004888, GO:0140375] | [FCER1A, PIGR] | [[IDA], [IDA]] | 1.895452 |
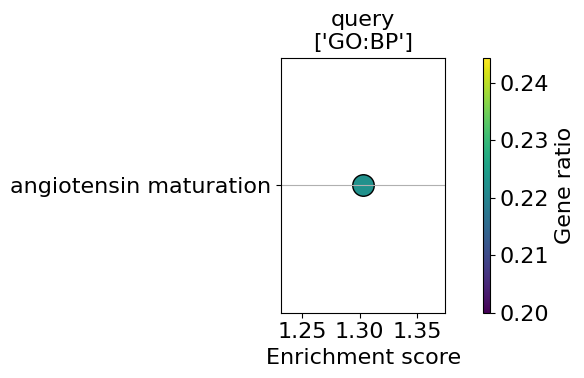
go_plot(enrichment=enrichment,
        style='dot',
        libraries='GO:BP',
        max_to_plot=5,
        figsize=(6,4),
        #savepath="figures/go_demo.pdf"
        )
GO term enrichment analysis for all three regions#
up_list = []
down_list = []
for i in range(len(exp)):
    dge = exp.dge(
        target_id=i,
        ref_id="rest",
        target_cell_type_tuple=("cell_type_dc_sub", "Macrophages"),
        plot_volcano=False,
        return_results=True
    )
    genes_up, genes_down = get_up_down_genes(dge['results'], pval_threshold=0.05, logfold_threshold=1)
    up_list.append(genes_up)
    down_list.append(genes_down)
Calculate differentially expressed genes with Scanpy's `rank_genes_groups` using 't-test'.
Calculate differentially expressed genes with Scanpy's `rank_genes_groups` using 't-test'.
Calculate differentially expressed genes with Scanpy's `rank_genes_groups` using 't-test'.
up_list
[['KRT7',
  'FOXA1',
  'KRT8',
  'FASN',
  'CCND1',
  'SCD',
  'APOC1',
  'EPCAM',
  'MYO5B',
  'SERHL2',
  'MLPH',
  'S100A14',
  'TCIM',
  'TENT5C',
  'ABCC11',
  'AR',
  'PCLAF',
  'TFAP2A',
  'ELF3',
  'TRAF4',
  'ELF5',
  'TUBB2B',
  'DMKN',
  'STC1',
  'LILRA4',
  'ESM1',
  'C6orf132',
  'SOX17',
  'SCGB2A1'],
 ['POSTN',
  'LUM',
  'CCDC80',
  'MMP2',
  'CRISPLD2',
  'LRRC15',
  'GJB2',
  'MEDAG',
  'LTB'],
 ['CEACAM6',
  'SFRP1',
  'ADH1B',
  'SERPINA3',
  'SFRP4',
  'KRT15',
  'OPRPN',
  'AQP1',
  'SDC4',
  'CLDN4',
  'LPL',
  'KRT23',
  'MMP12',
  'MYH11']]
# setup go term enrichment class
go = GOEnrichment()

for i, genes_up in enumerate(up_list):
    # run go term enrichment analysis for up-regulated genes
    go.gprofiler(target_genes=genes_up, key_added=f'Region{i+1}_up',
                top_n=20, organism="hsapiens", return_df=False
                )
The results are saved in the GOEnrichment class and can be accessed with the respective keys.
go
GOEnrichment analyses performed:
  gprofiler:
    - Region1_up
    - Region2_up
    - Region3_up
go_results = go.results["gprofiler"]
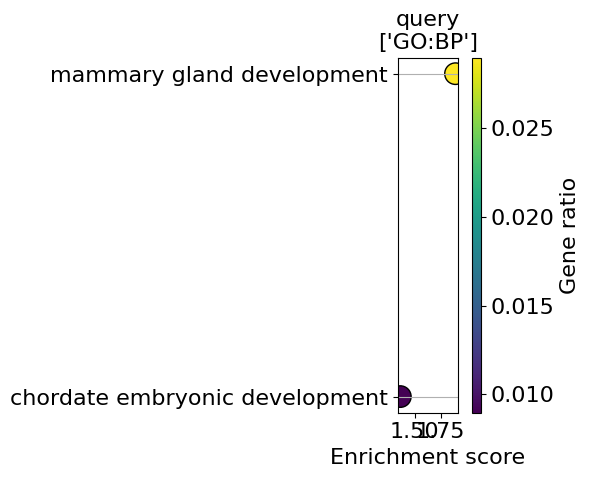
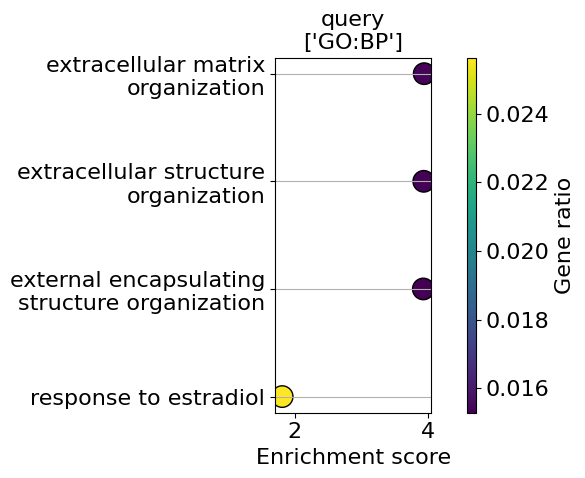
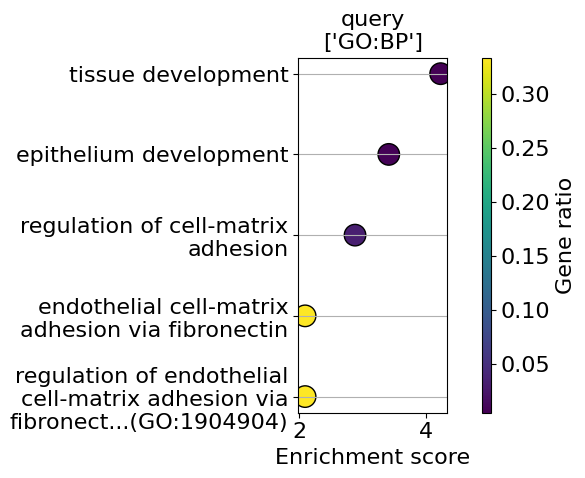
for i, k in enumerate(go_results.keys()):
enrichment = go_results[k]
go_plot(enrichment=enrichment,
style='dot',
libraries='GO:BP',
max_to_plot=5,
figsize=(6,5),
savepath=f"figures/go_demo_region{i+1}.pdf"
)
Saving figure to file figures/go_demo_region1.pdf
Saved.
Saving figure to file figures/go_demo_region2.pdf
Saved.
Saving figure to file figures/go_demo_region3.pdf
Saved.