Tutorial: Fluorescence Signal Quantification in InSituPy#
This tutorial demonstrates how to quantify fluorescence signals from microscopy images using the quantify_signal function of an InSituData object.
Overview#
The quantify_signal function allows you to:
Measure fluorescence intensity in cells from IF images
Choose between different quantification methods (mean, median, etc.)
Specify which cellular compartment to analyze (cells or nuclei)
Automatically add results to your AnnData object
## Ensure all functions are reloaded before execution
%load_ext autoreload
%autoreload 2
from pathlib import Path
from insitupy import InSituData, CACHE
Step 1: Load Your Data#
First, we load the InSituPy project and the necessary modalities.
# Read the InSituPy project
insitupy_project = Path(CACHE / "out/demo_insitupy_project")
xd = InSituData.read(insitupy_project)

# Load required modalities
xd.load_images()
xd.load_cells()
xd.load_annotations()
Step 2: Inspect Available Data#
Let’s check what cells and images are available.
# View cell data structure
xd.cells
MultiCellData with main layer 'main'
    table
        AnnData object with n_obs × n_vars = 156447 × 297
        obs: 'transcript_counts', 'control_probe_counts', 'control_codeword_counts', 'total_counts', 'cell_area', 'nucleus_area', 'n_genes_by_counts', 'n_genes', 'leiden', 'cell_type_dc_sub_final', 'cell_type_publ'
        var: 'gene_ids', 'feature_types', 'genome', 'n_cells_by_counts', 'mean_counts', 'pct_dropout_by_counts', 'total_counts', 'n_cells'
        uns: 'cell_type_dc_sub_final_colors', 'cell_type_publ_colors', 'leiden', 'leiden_colors', 'log1p', 'neighbors', 'pca', 'umap'
        obsm: 'X_pca', 'X_umap', 'annotations', 'regions', 'spatial'
        varm: 'PCs'
        layers: 'counts', 'norm_counts'
        obsp: 'connectivities', 'distances'
    boundaries
        BoundariesData object with 2 entries:
            cells
            nuclei
# Check available images
print("Available images:", list(xd.images.keys()))
Available images: ['CD20', 'HE', 'HER2', 'nuclei']
Step 3: Quantify Fluorescence Signal#
Now we’ll quantify the CD20 signal in cells using the median intensity method.
Parameters:#
image_name: Name of the fluorescence image to quantifycells_layer: Which cell layer to use (None = main layer)cells_compartment: Which compartment to measure (“cells” or “nuclei”)method: Quantification method (“median” is recommended)add_to_obs: Whether to add results to the AnnData .obs table
# Quantify CD20 signal with median intensity
xd.quantify_signal(
    image_name="CD20",
    cells_layer=None,
    cells_compartment="cells",
    method="median",
    add_to_obs=True
)
Added quantification results to `.cells['None'].table.obs['CD20_signal_cells_median']`.
# Quantify CD20 signal with median intensity
xd.quantify_signal(
    image_name="HER2",
    cells_layer=None,
    cells_compartment="cells",
    method="median",
    add_to_obs=True
)
Added quantification results to `.cells['None'].table.obs['HER2_signal_cells_median']`.
xd.cells
MultiCellData with main layer 'main'
    table
        AnnData object with n_obs × n_vars = 156447 × 297
        obs: 'transcript_counts', 'control_probe_counts', 'control_codeword_counts', 'total_counts', 'cell_area', 'nucleus_area', 'n_genes_by_counts', 'n_genes', 'leiden', 'cell_type_dc_sub_final', 'cell_type_publ', 'CD20_signal_cells_median', 'HER2_signal_cells_median'
        var: 'gene_ids', 'feature_types', 'genome', 'n_cells_by_counts', 'mean_counts', 'pct_dropout_by_counts', 'total_counts', 'n_cells'
        uns: 'cell_type_dc_sub_final_colors', 'cell_type_publ_colors', 'leiden', 'leiden_colors', 'log1p', 'neighbors', 'pca', 'umap'
        obsm: 'X_pca', 'X_umap', 'annotations', 'regions', 'spatial'
        varm: 'PCs'
        layers: 'counts', 'norm_counts'
        obsp: 'connectivities', 'distances'
    boundaries
        BoundariesData object with 2 entries:
            cells
            nuclei
Step 4: Inspect the Results#
The quantification results are stored in the .obs table of your AnnData object.
# View the first few rows of the results
xd.cells.matrix.obs[['CD20_signal_cells_median']].head()
| CD20_signal_cells_median | |
|---|---|
| 2 | 2.0 |
| 5 | 2.0 |
| 8 | 2.0 |
| 10 | 1.0 |
| 13 | 2.0 |
# Summary statistics
import pandas as pd

print("CD20 Signal Statistics:")
print(xd.cells.matrix.obs['CD20_signal_cells_median'].describe())
CD20 Signal Statistics:
count    156447.000000
mean          2.813595
std           5.270226
min           0.000000
25%           1.000000
50%           2.000000
75%           3.000000
max          85.000000
Name: CD20_signal_cells_median, dtype: float64
Step 5: Visualize the Results#
Let’s create some visualizations to explore the quantified signal.
Interactive visualization#
xd.show()
WARNING: The selected layer does not contain any plottable data.
INFO: Saved color legend to 'C:\Users\ge37voy\Downloads\colorlegend-main-HER2_signal_cells_median.pdf'
Static plotting#
from insitupy.plotting import spatial
spatial(
    data=xd,
    keys='CD20_signal_cells_median',
    image_key='CD20',
)
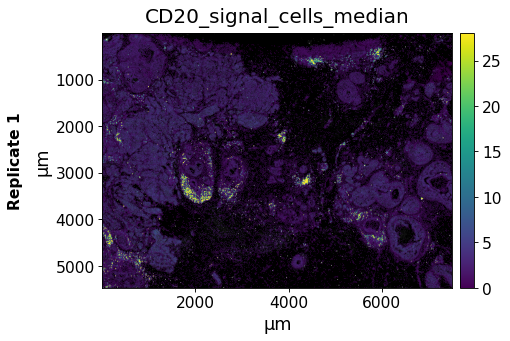
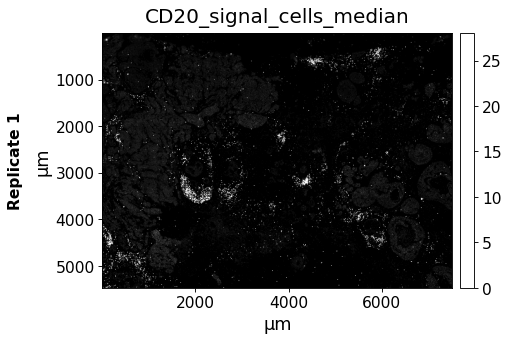
Plotting of the CD20 image shows that the signals are overlapping very well. To show only the image data we set the spots transparent with alpha=0.
spatial(
    data=xd,
    keys='CD20_signal_cells_median',
    image_key='CD20',
    alpha=0
)
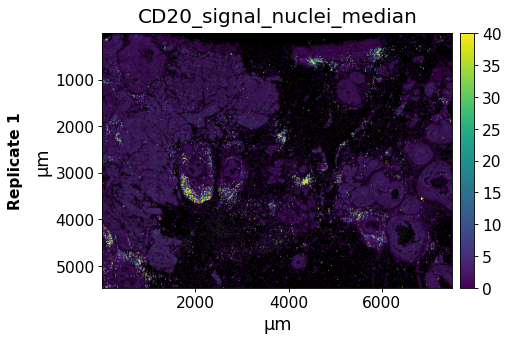
Quantifying Nuclear Signals#
You can also quantify signals in nuclei specifically:
# Quantify signal in nuclei
xd.quantify_signal(
    image_name="CD20",
    cells_layer=None,
    cells_compartment="nuclei",
    method="median",
    add_to_obs=True
)
Added quantification results to `.cells['None'].matrix.obs['CD20_signal_nuclei_median']`.
from insitupy.plotting import spatial
spatial(
    data=xd,
    keys='CD20_signal_nuclei_median',
    image_key='CD20',
)
Processing very large images in memory-efficient manner#
In case of very large images, loading the full image into memory can cause problems. For such cases, a memory-efficient tile-based approach is implemented and can be invoked by specifying a tile_size. This approach takes longer but requires significantly less memory.
# Quantify signal in nuclei
xd.quantify_signal(
    image_name="CD20",
    cells_layer=None,
    cells_compartment="cells",
    method="median",
    tile_size=4000,
    add_to_obs=True
)
Quantification using tiled approach with overlap 470...
Collecting results...
Added quantification results to `.cells['None'].matrix.obs['CD20_signal_cells_median']`.
from insitupy.plotting import spatial
spatial(
    data=xd,
    keys='CD20_signal_cells_median',
    image_key='CD20',
)